
 Yahoo Finance
 What Should Investors Know About The Future Of GWA Group Limited’s (ASX:GWA)?

In June 2018, GWA Group Limited (ASX:GWA) released its latest earnings announcement, which revealed that the business benefited from a slight tailwind, eventuating to a single-digit earnings growth of 1.8%. Today I want to provide a brief commentary on how market analysts view GWA Group’s earnings growth outlook over the next few years and whether the future looks even brighter than the past. I will be looking at earnings excluding extraordinary items to exclude one-off activities to get a better understanding of the underlying drivers of earnings.
View our latest analysis for GWA Group
Analysts’ outlook for next year seems pessimistic, with earnings decreasing by -2.7%. But in the following year, there is a complete contrast in performance, with reaching double digit 9.2% compared to today’s level and continues to increase to AU$57.4m in 2021.
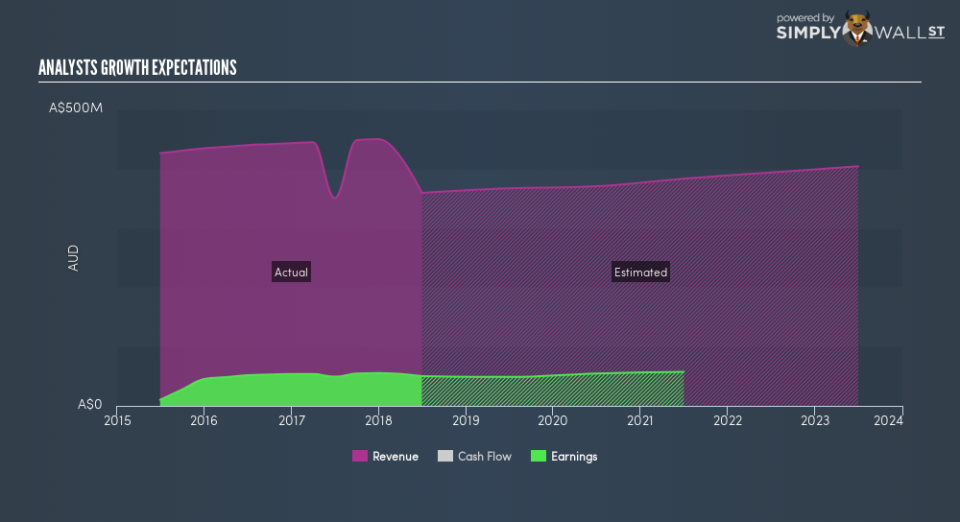
While it’s helpful to be aware of the rate of growth year by year relative to today’s level, it may be more valuable to analyze the rate at which the business is growing every year, on average. The pro of this technique is that it removes the impact of near term flucuations and accounts for the overarching direction of GWA Group’s earnings trajectory over time, which may be more relevant for long term investors. To compute this rate, I’ve inserted a line of best fit through analyst consensus of forecasted earnings. The slope of this line is the rate of earnings growth, which in this case is 5.1%. This means, we can anticipate GWA Group will grow its earnings by 5.1% every year for the next few years.
Next Steps:
For GWA Group, I’ve compiled three fundamental aspects you should further examine:
Financial Health: Does it have a healthy balance sheet? Take a look at our free balance sheet analysis with six simple checks on key factors like leverage and risk.
Valuation: What is GWA worth today? Is the stock undervalued, even when its growth outlook is factored into its intrinsic value? The intrinsic value infographic in our free research report helps visualize whether GWA is currently mispriced by the market.
Other High-Growth Alternatives: Are there other high-growth stocks you could be holding instead of GWA? Explore our interactive list of stocks with large growth potential to get an idea of what else is out there you may be missing!
To help readers see past the short term volatility of the financial market, we aim to bring you a long-term focused research analysis purely driven by fundamental data. Note that our analysis does not factor in the latest price-sensitive company announcements.
The author is an independent contributor and at the time of publication had no position in the stocks mentioned. For errors that warrant correction please contact the editor at editorial-team@simplywallst.com.
