
 Yahoo Finance
 What Investors Should Know About Fletcher Building Limited’s (NZSE:FBU) Financial Strength

Small and large cap stocks are widely popular for a variety of reasons, however, mid-cap companies such as Fletcher Building Limited (NZSE:FBU), with a market cap of NZ$5.79b, often get neglected by retail investors. However, history shows that overlooked mid-cap companies have performed better on a risk-adjusted manner than the smaller and larger segment of the market. Today we will look at FBU’s financial liquidity and debt levels, which are strong indicators for whether the company can weather economic downturns or fund strategic acquisitions for future growth. Remember this is a very top-level look that focuses exclusively on financial health, so I recommend a deeper analysis into FBU here. View out our latest analysis for Fletcher Building
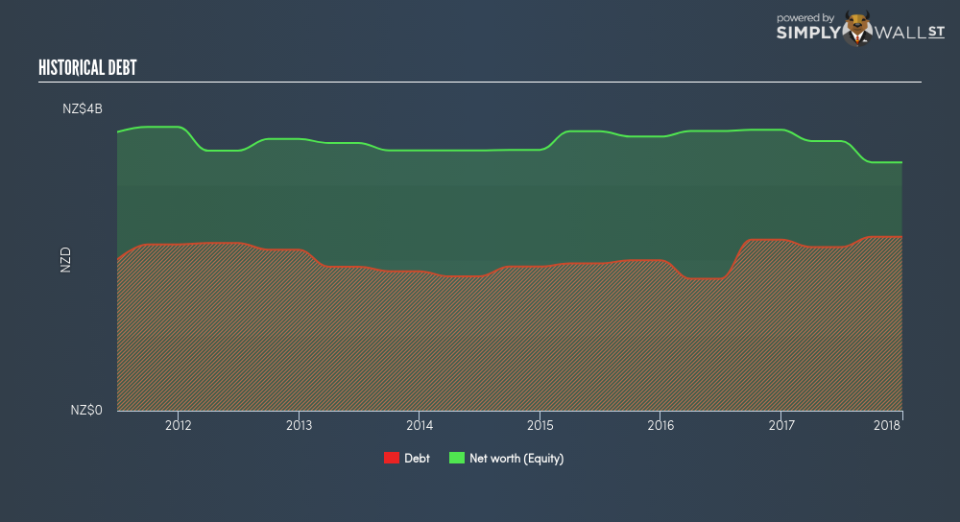
Does FBU produce enough cash relative to debt?
Over the past year, FBU has ramped up its debt from NZ$1.75b to NZ$2.17b , which comprises of short- and long-term debt. With this increase in debt, FBU currently has NZ$219.00m remaining in cash and short-term investments , ready to deploy into the business. Moreover, FBU has generated NZ$243.00m in operating cash flow in the last twelve months, leading to an operating cash to total debt ratio of 11.19%, signalling that FBU’s debt is not appropriately covered by operating cash. This ratio can also be a sign of operational efficiency for unprofitable companies since metrics such as return on asset (ROA) requires a positive net income. In FBU’s case, it is able to generate 0.11x cash from its debt capital.
Can FBU pay its short-term liabilities?
With current liabilities at NZ$2.00b, it appears that the company has been able to meet these commitments with a current assets level of NZ$3.42b, leading to a 1.71x current account ratio. Generally, for Basic Materials companies, this is a reasonable ratio since there is a bit of a cash buffer without leaving too much capital in a low-return environment.
Does FBU face the risk of succumbing to its debt-load?
With debt reaching 70.05% of equity, FBU may be thought of as relatively highly levered. This is not uncommon for a mid-cap company given that debt tends to be lower-cost and at times, more accessible. But since FBU is currently unprofitable, there’s a question of sustainability of its current operations. Running high debt, while not yet making money, can be risky in unexpected downturns as liquidity may dry up, making it hard to operate.
Next Steps:
FBU’s debt and cash flow levels indicate room for improvement. Its cash flow coverage of less than a quarter of debt means that operating efficiency could be an issue. However, the company exhibits proper management of current assets and upcoming liabilities. This is only a rough assessment of financial health, and I’m sure FBU has company-specific issues impacting its capital structure decisions. I recommend you continue to research Fletcher Building to get a more holistic view of the stock by looking at:
Future Outlook: What are well-informed industry analysts predicting for FBU’s future growth? Take a look at our free research report of analyst consensus for FBU’s outlook.
Valuation: What is FBU worth today? Is the stock undervalued, even when its growth outlook is factored into its intrinsic value? The intrinsic value infographic in our free research report helps visualize whether FBU is currently mispriced by the market.
Other High-Performing Stocks: Are there other stocks that provide better prospects with proven track records? Explore our free list of these great stocks here.
To help readers see pass the short term volatility of the financial market, we aim to bring you a long-term focused research analysis purely driven by fundamental data. Note that our analysis does not factor in the latest price sensitive company announcements.
The author is an independent contributor and at the time of publication had no position in the stocks mentioned.
