
 Yahoo Finance
 What Investors Should Know About Champion Iron Limited’s (ASX:CIA) Financial Strength

Champion Iron Limited (ASX:CIA) is a small-cap stock with a market capitalization of AU$559.83M. While investors primarily focus on the growth potential and competitive landscape of the small-cap companies, they end up ignoring a key aspect, which could be the biggest threat to its existence: its financial health. Why is it important? Since CIA is loss-making right now, it’s essential to assess the current state of its operations and pathway to profitability. I believe these basic checks tell most of the story you need to know. Nevertheless, since I only look at basic financial figures, I recommend you dig deeper yourself into CIA here.
How does CIA’s operating cash flow stack up against its debt?
CIA has increased its debt level by about CA$43.61M over the last 12 months – this includes both the current and long-term debt. With this growth in debt, the current cash and short-term investment levels stands at CA$11.69M , ready to deploy into the business. Moving onto cash from operations, its small level of operating cash flow means calculating cash-to-debt wouldn’t be too useful, though these low levels of cash means that operational efficiency is worth a look. As the purpose of this article is a high-level overview, I won’t be looking at this today, but you can take a look at some of CIA’s operating efficiency ratios such as ROA here.
Can CIA pay its short-term liabilities?
At the current liabilities level of CA$7.66M liabilities, the company has been able to meet these obligations given the level of current assets of CA$20.60M, with a current ratio of 2.69x. Usually, for Metals and Mining companies, this is a suitable ratio since there’s sufficient cash cushion without leaving too much capital idle or in low-earning investments.
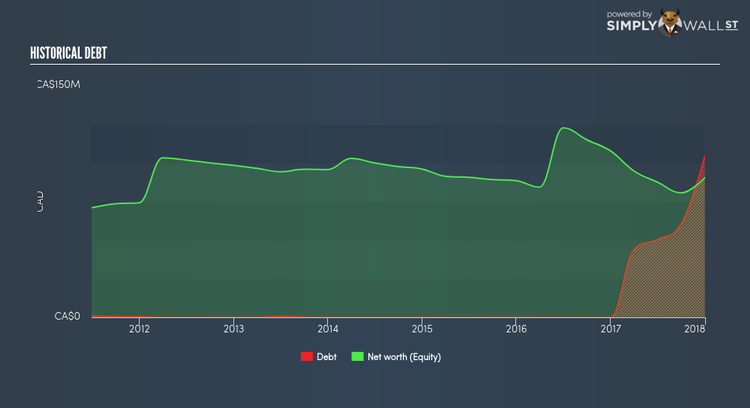
Does CIA face the risk of succumbing to its debt-load?
Since total debt levels have outpaced equities, CIA is a highly leveraged company. This is not unusual for small-caps as debt tends to be a cheaper and faster source of funding for some businesses. However, since CIA is currently unprofitable, sustainability of its current state of operations becomes a concern. Running high debt, while not yet making money, can be risky in unexpected downturns as liquidity may dry up, making it hard to operate.
Next Steps:
CIA’s debt and cash flow levels indicate room for improvement. Its cash flow coverage of less than a quarter of debt means that operating efficiency could be an issue. However, the company will be able to pay all of its upcoming liabilities from its current short-term assets. Keep in mind I haven’t considered other factors such as how CIA has been performing in the past. I recommend you continue to research Champion Iron to get a better picture of the stock by looking at:
Historical Performance: What has CIA’s returns been like over the past? Go into more detail in the past track record analysis and take a look at the free visual representations of our analysis for more clarity.
Other High-Performing Stocks: Are there other stocks that provide better prospects with proven track records? Explore our free list of these great stocks here.
To help readers see pass the short term volatility of the financial market, we aim to bring you a long-term focused research analysis purely driven by fundamental data. Note that our analysis does not factor in the latest price sensitive company announcements.
The author is an independent contributor and at the time of publication had no position in the stocks mentioned.
