
 Yahoo Finance
 Investors in Iteris (NASDAQ:ITI) have unfortunately lost 24% over the last three years
In order to justify the effort of selecting individual stocks, it's worth striving to beat the returns from a market index fund. But the risk of stock picking is that you will likely buy under-performing companies. We regret to report that long term Iteris, Inc. (NASDAQ:ITI) shareholders have had that experience, with the share price dropping 24% in three years, versus a market return of about 20%.
Since shareholders are down over the longer term, lets look at the underlying fundamentals over the that time and see if they've been consistent with returns.
Check out our latest analysis for Iteris
While the efficient markets hypothesis continues to be taught by some, it has been proven that markets are over-reactive dynamic systems, and investors are not always rational. One imperfect but simple way to consider how the market perception of a company has shifted is to compare the change in the earnings per share (EPS) with the share price movement.
Iteris became profitable within the last five years. We would usually expect to see the share price rise as a result. So it's worth looking at other metrics to try to understand the share price move.
Revenue is actually up 14% over the three years, so the share price drop doesn't seem to hinge on revenue, either. It's probably worth investigating Iteris further; while we may be missing something on this analysis, there might also be an opportunity.
The image below shows how earnings and revenue have tracked over time (if you click on the image you can see greater detail).
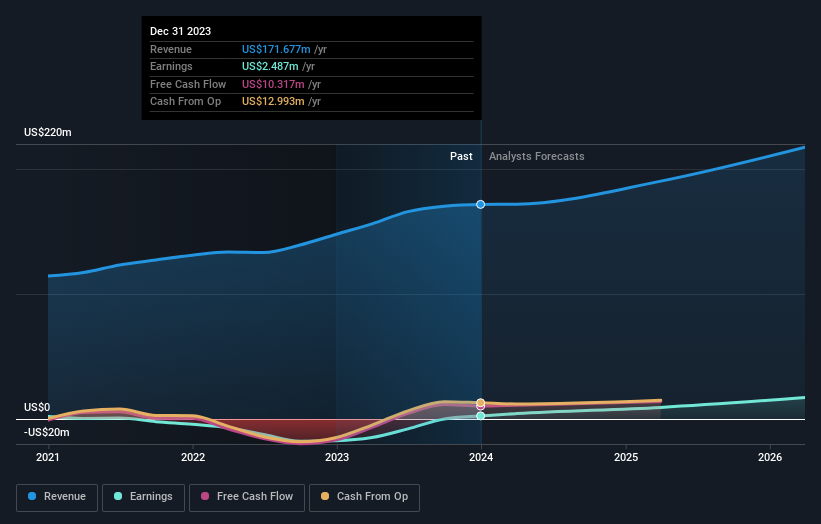
We know that Iteris has improved its bottom line lately, but what does the future have in store? You can see what analysts are predicting for Iteris in this interactive graph of future profit estimates.
A Different Perspective
Iteris shareholders are up 2.1% for the year. But that was short of the market average. On the bright side, the longer term returns (running at about 3% a year, over half a decade) look better. It's quite possible the business continues to execute with prowess, even as the share price gains are slowing. Most investors take the time to check the data on insider transactions. You can click here to see if insiders have been buying or selling.
If you are like me, then you will not want to miss this free list of growing companies that insiders are buying.
Please note, the market returns quoted in this article reflect the market weighted average returns of stocks that currently trade on American exchanges.
Have feedback on this article? Concerned about the content? Get in touch with us directly. Alternatively, email editorial-team (at) simplywallst.com.
This article by Simply Wall St is general in nature. We provide commentary based on historical data and analyst forecasts only using an unbiased methodology and our articles are not intended to be financial advice. It does not constitute a recommendation to buy or sell any stock, and does not take account of your objectives, or your financial situation. We aim to bring you long-term focused analysis driven by fundamental data. Note that our analysis may not factor in the latest price-sensitive company announcements or qualitative material. Simply Wall St has no position in any stocks mentioned.
