
 Yahoo Finance
 Investors in Imperial Metals (TSE:III) have unfortunately lost 55% over the last three years
Investing in stocks inevitably means buying into some companies that perform poorly. Long term Imperial Metals Corporation (TSE:III) shareholders know that all too well, since the share price is down considerably over three years. Unfortunately, they have held through a 55% decline in the share price in that time.
With that in mind, it's worth seeing if the company's underlying fundamentals have been the driver of long term performance, or if there are some discrepancies.
Check out our latest analysis for Imperial Metals
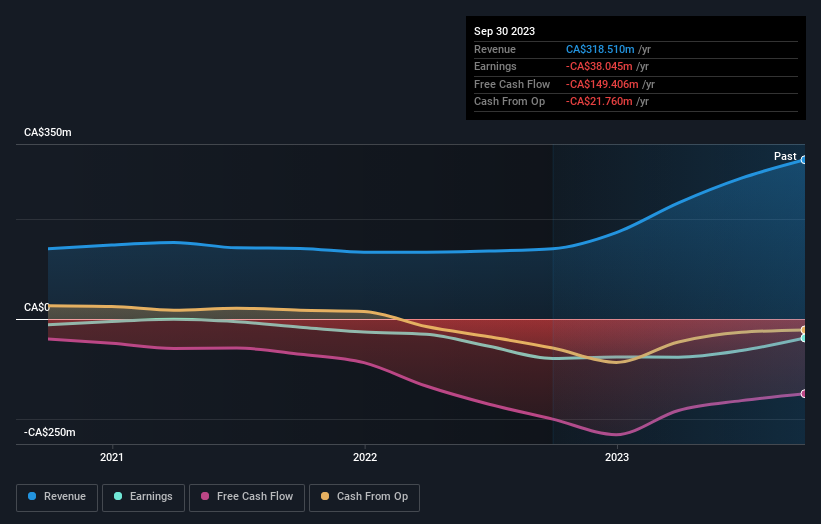
Imperial Metals wasn't profitable in the last twelve months, it is unlikely we'll see a strong correlation between its share price and its earnings per share (EPS). Arguably revenue is our next best option. When a company doesn't make profits, we'd generally expect to see good revenue growth. As you can imagine, fast revenue growth, when maintained, often leads to fast profit growth.
In the last three years, Imperial Metals saw its revenue grow by 27% per year, compound. That's well above most other pre-profit companies. In contrast, the share price is down 16% compound, over three years - disappointing by most standards. It seems likely that the market is worried about the continual losses. When we see revenue growth, paired with a falling share price, we can't help wonder if there is an opportunity for those who are willing to dig deeper.
The image below shows how earnings and revenue have tracked over time (if you click on the image you can see greater detail).
We consider it positive that insiders have made significant purchases in the last year. Having said that, most people consider earnings and revenue growth trends to be a more meaningful guide to the business. Dive deeper into the earnings by checking this interactive graph of Imperial Metals' earnings, revenue and cash flow.
A Different Perspective
Imperial Metals provided a TSR of 16% over the year. That's fairly close to the broader market return. To take a positive view, the gain is pleasing, and it sure beats annualized TSR loss of 6%, which was endured over half a decade. We're pretty skeptical of turnaround stories, but it's good to see the recent share price recovery. I find it very interesting to look at share price over the long term as a proxy for business performance. But to truly gain insight, we need to consider other information, too. Even so, be aware that Imperial Metals is showing 1 warning sign in our investment analysis , you should know about...
Imperial Metals is not the only stock insiders are buying. So take a peek at this free list of growing companies with insider buying.
Please note, the market returns quoted in this article reflect the market weighted average returns of stocks that currently trade on Canadian exchanges.
Have feedback on this article? Concerned about the content? Get in touch with us directly. Alternatively, email editorial-team (at) simplywallst.com.
This article by Simply Wall St is general in nature. We provide commentary based on historical data and analyst forecasts only using an unbiased methodology and our articles are not intended to be financial advice. It does not constitute a recommendation to buy or sell any stock, and does not take account of your objectives, or your financial situation. We aim to bring you long-term focused analysis driven by fundamental data. Note that our analysis may not factor in the latest price-sensitive company announcements or qualitative material. Simply Wall St has no position in any stocks mentioned.
