
 Yahoo Finance
 Investors in Hunting (LON:HTG) have seen favorable returns of 58% over the past year
Passive investing in index funds can generate returns that roughly match the overall market. But one can do better than that by picking better than average stocks (as part of a diversified portfolio). For example, the Hunting PLC (LON:HTG) share price is up 54% in the last 1 year, clearly besting the market decline of around 1.8% (not including dividends). If it can keep that out-performance up over the long term, investors will do very well! Looking back further, the stock price is 39% higher than it was three years ago.
So let's investigate and see if the longer term performance of the company has been in line with the underlying business' progress.
See our latest analysis for Hunting
While the efficient markets hypothesis continues to be taught by some, it has been proven that markets are over-reactive dynamic systems, and investors are not always rational. One imperfect but simple way to consider how the market perception of a company has shifted is to compare the change in the earnings per share (EPS) with the share price movement.
Hunting went from making a loss to reporting a profit, in the last year.
When a company has just transitioned to profitability, earnings per share growth is not always the best way to look at the share price action.
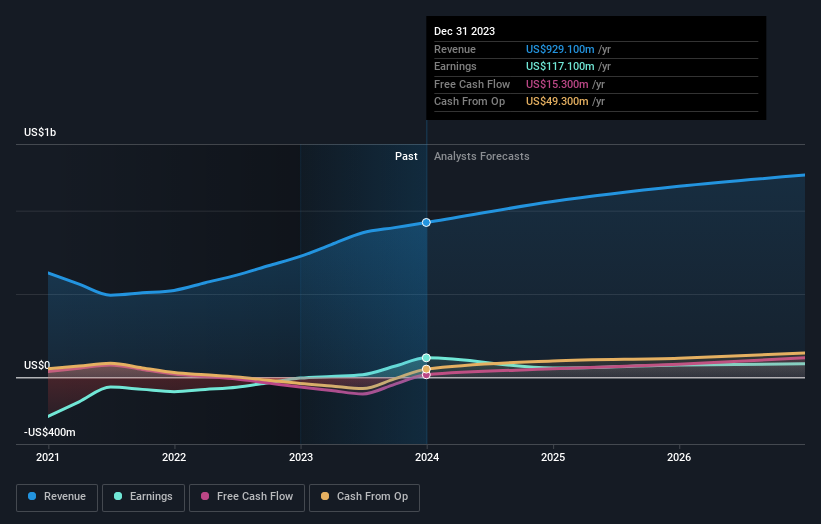
However the year on year revenue growth of 28% would help. We do see some companies suppress earnings in order to accelerate revenue growth.
You can see below how earnings and revenue have changed over time (discover the exact values by clicking on the image).
We know that Hunting has improved its bottom line over the last three years, but what does the future have in store? This free interactive report on Hunting's balance sheet strength is a great place to start, if you want to investigate the stock further.
What About Dividends?
As well as measuring the share price return, investors should also consider the total shareholder return (TSR). Whereas the share price return only reflects the change in the share price, the TSR includes the value of dividends (assuming they were reinvested) and the benefit of any discounted capital raising or spin-off. So for companies that pay a generous dividend, the TSR is often a lot higher than the share price return. As it happens, Hunting's TSR for the last 1 year was 58%, which exceeds the share price return mentioned earlier. The dividends paid by the company have thusly boosted the total shareholder return.
A Different Perspective
It's good to see that Hunting has rewarded shareholders with a total shareholder return of 58% in the last twelve months. Of course, that includes the dividend. That certainly beats the loss of about 5% per year over the last half decade. The long term loss makes us cautious, but the short term TSR gain certainly hints at a brighter future. While it is well worth considering the different impacts that market conditions can have on the share price, there are other factors that are even more important. To that end, you should learn about the 2 warning signs we've spotted with Hunting (including 1 which shouldn't be ignored) .
For those who like to find winning investments this free list of growing companies with recent insider purchasing, could be just the ticket.
Please note, the market returns quoted in this article reflect the market weighted average returns of stocks that currently trade on British exchanges.
Have feedback on this article? Concerned about the content? Get in touch with us directly. Alternatively, email editorial-team (at) simplywallst.com.
This article by Simply Wall St is general in nature. We provide commentary based on historical data and analyst forecasts only using an unbiased methodology and our articles are not intended to be financial advice. It does not constitute a recommendation to buy or sell any stock, and does not take account of your objectives, or your financial situation. We aim to bring you long-term focused analysis driven by fundamental data. Note that our analysis may not factor in the latest price-sensitive company announcements or qualitative material. Simply Wall St has no position in any stocks mentioned.
