
 Yahoo Finance
 Investors Holding Back On Brookfield Renewable Corporation (TSE:BEPC)
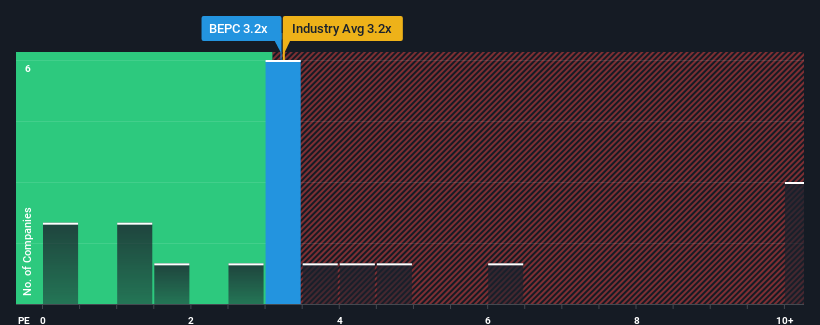
It's not a stretch to say that Brookfield Renewable Corporation's (TSE:BEPC) price-to-sales (or "P/S") ratio of 3.2x seems quite "middle-of-the-road" for Renewable Energy companies in Canada, seeing as it matches the P/S ratio of the wider industry. However, investors might be overlooking a clear opportunity or potential setback if there is no rational basis for the P/S.
Check out our latest analysis for Brookfield Renewable
How Has Brookfield Renewable Performed Recently?
Recent times haven't been great for Brookfield Renewable as its revenue has been rising slower than most other companies. It might be that many expect the uninspiring revenue performance to strengthen positively, which has kept the P/S ratio from falling. You'd really hope so, otherwise you're paying a relatively elevated price for a company with this sort of growth profile.
Keen to find out how analysts think Brookfield Renewable's future stacks up against the industry? In that case, our free report is a great place to start.
Do Revenue Forecasts Match The P/S Ratio?
In order to justify its P/S ratio, Brookfield Renewable would need to produce growth that's similar to the industry.
Retrospectively, the last year delivered a decent 11% gain to the company's revenues. The solid recent performance means it was also able to grow revenue by 12% in total over the last three years. Therefore, it's fair to say the revenue growth recently has been respectable for the company.
Shifting to the future, estimates from the three analysts covering the company suggest revenue should grow by 8.1% each year over the next three years. With the industry only predicted to deliver 3.6% each year, the company is positioned for a stronger revenue result.
With this information, we find it interesting that Brookfield Renewable is trading at a fairly similar P/S compared to the industry. Apparently some shareholders are skeptical of the forecasts and have been accepting lower selling prices.
The Key Takeaway
Using the price-to-sales ratio alone to determine if you should sell your stock isn't sensible, however it can be a practical guide to the company's future prospects.
We've established that Brookfield Renewable currently trades on a lower than expected P/S since its forecasted revenue growth is higher than the wider industry. Perhaps uncertainty in the revenue forecasts are what's keeping the P/S ratio consistent with the rest of the industry. This uncertainty seems to be reflected in the share price which, while stable, could be higher given the revenue forecasts.
Before you settle on your opinion, we've discovered 4 warning signs for Brookfield Renewable (2 are concerning!) that you should be aware of.
Of course, profitable companies with a history of great earnings growth are generally safer bets. So you may wish to see this free collection of other companies that have reasonable P/E ratios and have grown earnings strongly.
Have feedback on this article? Concerned about the content? Get in touch with us directly. Alternatively, email editorial-team (at) simplywallst.com.
This article by Simply Wall St is general in nature. We provide commentary based on historical data and analyst forecasts only using an unbiased methodology and our articles are not intended to be financial advice. It does not constitute a recommendation to buy or sell any stock, and does not take account of your objectives, or your financial situation. We aim to bring you long-term focused analysis driven by fundamental data. Note that our analysis may not factor in the latest price-sensitive company announcements or qualitative material. Simply Wall St has no position in any stocks mentioned.
Join A Paid User Research Session
You’ll receive a US$30 Amazon Gift card for 1 hour of your time while helping us build better investing tools for the individual investors like yourself. Sign up here
