
 Yahoo Finance
 Investors who have held Qube Holdings (ASX:QUB) over the last three years have watched its earnings decline along with their investment
While not a mind-blowing move, it is good to see that the Qube Holdings Limited (ASX:QUB) share price has gained 17% in the last three months. But that doesn't change the fact that the returns over the last three years have been less than pleasing. After all, the share price is down 18% in the last three years, significantly under-performing the market.
The recent uptick of 3.9% could be a positive sign of things to come, so let's take a look at historical fundamentals.
View our latest analysis for Qube Holdings
While the efficient markets hypothesis continues to be taught by some, it has been proven that markets are over-reactive dynamic systems, and investors are not always rational. By comparing earnings per share (EPS) and share price changes over time, we can get a feel for how investor attitudes to a company have morphed over time.
Qube Holdings became profitable within the last five years. We would usually expect to see the share price rise as a result. So given the share price is down it's worth checking some other metrics too.
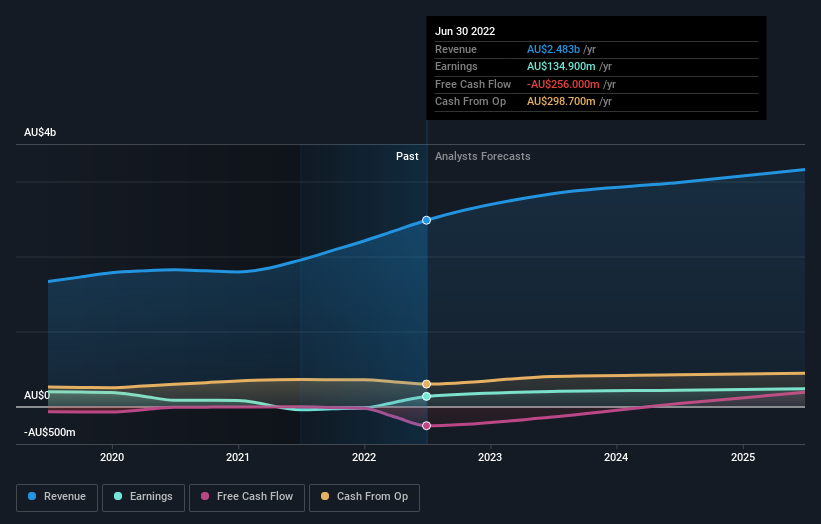
We note that, in three years, revenue has actually grown at a 12% annual rate, so that doesn't seem to be a reason to sell shares. This analysis is just perfunctory, but it might be worth researching Qube Holdings more closely, as sometimes stocks fall unfairly. This could present an opportunity.
The company's revenue and earnings (over time) are depicted in the image below (click to see the exact numbers).
Qube Holdings is a well known stock, with plenty of analyst coverage, suggesting some visibility into future growth. If you are thinking of buying or selling Qube Holdings stock, you should check out this free report showing analyst consensus estimates for future profits.
What About Dividends?
It is important to consider the total shareholder return, as well as the share price return, for any given stock. Whereas the share price return only reflects the change in the share price, the TSR includes the value of dividends (assuming they were reinvested) and the benefit of any discounted capital raising or spin-off. Arguably, the TSR gives a more comprehensive picture of the return generated by a stock. In the case of Qube Holdings, it has a TSR of -10.0% for the last 3 years. That exceeds its share price return that we previously mentioned. This is largely a result of its dividend payments!
A Different Perspective
We're pleased to report that Qube Holdings shareholders have received a total shareholder return of 1.8% over one year. That's including the dividend. However, the TSR over five years, coming in at 5% per year, is even more impressive. Potential buyers might understandably feel they've missed the opportunity, but it's always possible business is still firing on all cylinders. Most investors take the time to check the data on insider transactions. You can click here to see if insiders have been buying or selling.
Of course Qube Holdings may not be the best stock to buy. So you may wish to see this free collection of growth stocks.
Please note, the market returns quoted in this article reflect the market weighted average returns of stocks that currently trade on AU exchanges.
Have feedback on this article? Concerned about the content? Get in touch with us directly. Alternatively, email editorial-team (at) simplywallst.com.
This article by Simply Wall St is general in nature. We provide commentary based on historical data and analyst forecasts only using an unbiased methodology and our articles are not intended to be financial advice. It does not constitute a recommendation to buy or sell any stock, and does not take account of your objectives, or your financial situation. We aim to bring you long-term focused analysis driven by fundamental data. Note that our analysis may not factor in the latest price-sensitive company announcements or qualitative material. Simply Wall St has no position in any stocks mentioned.
Join A Paid User Research Session
You’ll receive a US$30 Amazon Gift card for 1 hour of your time while helping us build better investing tools for the individual investors like yourself. Sign up here
