
 Yahoo Finance
 Investors Should Be Encouraged By Korvest's (ASX:KOV) Returns On Capital
If we want to find a stock that could multiply over the long term, what are the underlying trends we should look for? Amongst other things, we'll want to see two things; firstly, a growing return on capital employed (ROCE) and secondly, an expansion in the company's amount of capital employed. Ultimately, this demonstrates that it's a business that is reinvesting profits at increasing rates of return. With that in mind, the ROCE of Korvest (ASX:KOV) looks great, so lets see what the trend can tell us.
Return On Capital Employed (ROCE): What Is It?
If you haven't worked with ROCE before, it measures the 'return' (pre-tax profit) a company generates from capital employed in its business. To calculate this metric for Korvest, this is the formula:
Return on Capital Employed = Earnings Before Interest and Tax (EBIT) ÷ (Total Assets - Current Liabilities)
0.29 = AU$18m ÷ (AU$75m - AU$14m) (Based on the trailing twelve months to December 2023).
Thus, Korvest has an ROCE of 29%. That's a fantastic return and not only that, it outpaces the average of 13% earned by companies in a similar industry.
View our latest analysis for Korvest
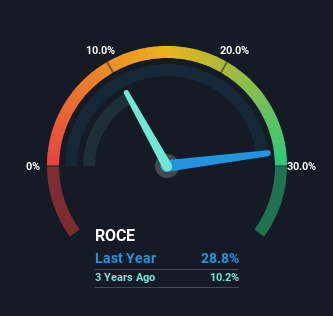
Historical performance is a great place to start when researching a stock so above you can see the gauge for Korvest's ROCE against it's prior returns. If you'd like to look at how Korvest has performed in the past in other metrics, you can view this free graph of Korvest's past earnings, revenue and cash flow.
How Are Returns Trending?
Investors would be pleased with what's happening at Korvest. Over the last five years, returns on capital employed have risen substantially to 29%. Basically the business is earning more per dollar of capital invested and in addition to that, 97% more capital is being employed now too. This can indicate that there's plenty of opportunities to invest capital internally and at ever higher rates, a combination that's common among multi-baggers.
The Key Takeaway
All in all, it's terrific to see that Korvest is reaping the rewards from prior investments and is growing its capital base. Since the stock has returned a staggering 344% to shareholders over the last five years, it looks like investors are recognizing these changes. In light of that, we think it's worth looking further into this stock because if Korvest can keep these trends up, it could have a bright future ahead.
On a separate note, we've found 2 warning signs for Korvest you'll probably want to know about.
Korvest is not the only stock earning high returns. If you'd like to see more, check out our free list of companies earning high returns on equity with solid fundamentals.
Have feedback on this article? Concerned about the content? Get in touch with us directly. Alternatively, email editorial-team (at) simplywallst.com.
This article by Simply Wall St is general in nature. We provide commentary based on historical data and analyst forecasts only using an unbiased methodology and our articles are not intended to be financial advice. It does not constitute a recommendation to buy or sell any stock, and does not take account of your objectives, or your financial situation. We aim to bring you long-term focused analysis driven by fundamental data. Note that our analysis may not factor in the latest price-sensitive company announcements or qualitative material. Simply Wall St has no position in any stocks mentioned.
