
 Yahoo Finance
 Investors in CSL (ASX:CSL) have made a impressive return of 118% over the past five years
The most you can lose on any stock (assuming you don't use leverage) is 100% of your money. But when you pick a company that is really flourishing, you can make more than 100%. For example, the CSL Limited (ASX:CSL) share price has soared 106% in the last half decade. Most would be very happy with that. In the last week shares have slid back 1.4%.
So let's investigate and see if the longer term performance of the company has been in line with the underlying business' progress.
View our latest analysis for CSL
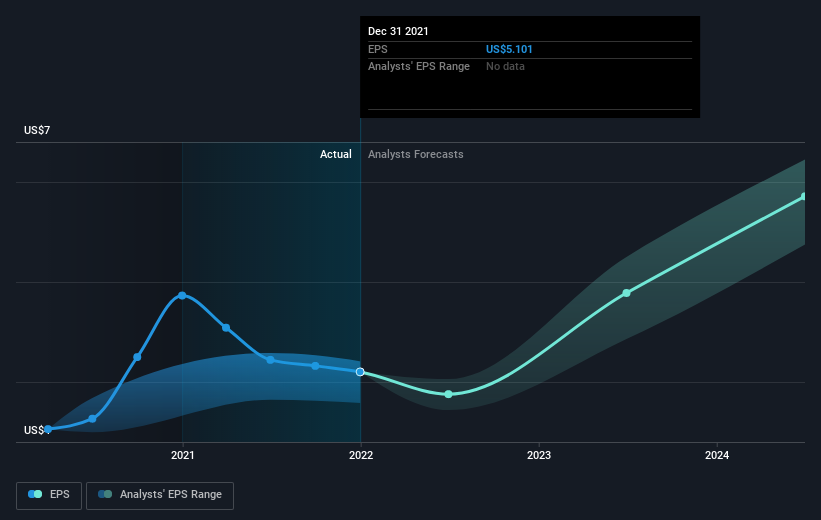
While markets are a powerful pricing mechanism, share prices reflect investor sentiment, not just underlying business performance. By comparing earnings per share (EPS) and share price changes over time, we can get a feel for how investor attitudes to a company have morphed over time.
Over half a decade, CSL managed to grow its earnings per share at 11% a year. This EPS growth is lower than the 15% average annual increase in the share price. So it's fair to assume the market has a higher opinion of the business than it did five years ago. And that's hardly shocking given the track record of growth.
You can see how EPS has changed over time in the image below (click on the chart to see the exact values).
This free interactive report on CSL's earnings, revenue and cash flow is a great place to start, if you want to investigate the stock further.
What About Dividends?
As well as measuring the share price return, investors should also consider the total shareholder return (TSR). The TSR is a return calculation that accounts for the value of cash dividends (assuming that any dividend received was reinvested) and the calculated value of any discounted capital raisings and spin-offs. So for companies that pay a generous dividend, the TSR is often a lot higher than the share price return. We note that for CSL the TSR over the last 5 years was 118%, which is better than the share price return mentioned above. The dividends paid by the company have thusly boosted the total shareholder return.
A Different Perspective
Investors in CSL had a tough year, with a total loss of 0.9% (including dividends), against a market gain of about 11%. However, keep in mind that even the best stocks will sometimes underperform the market over a twelve month period. Longer term investors wouldn't be so upset, since they would have made 17%, each year, over five years. If the fundamental data continues to indicate long term sustainable growth, the current sell-off could be an opportunity worth considering. It's always interesting to track share price performance over the longer term. But to understand CSL better, we need to consider many other factors. Consider for instance, the ever-present spectre of investment risk. We've identified 1 warning sign with CSL , and understanding them should be part of your investment process.
If you like to buy stocks alongside management, then you might just love this free list of companies. (Hint: insiders have been buying them).
Please note, the market returns quoted in this article reflect the market weighted average returns of stocks that currently trade on AU exchanges.
Have feedback on this article? Concerned about the content? Get in touch with us directly. Alternatively, email editorial-team (at) simplywallst.com.
This article by Simply Wall St is general in nature. We provide commentary based on historical data and analyst forecasts only using an unbiased methodology and our articles are not intended to be financial advice. It does not constitute a recommendation to buy or sell any stock, and does not take account of your objectives, or your financial situation. We aim to bring you long-term focused analysis driven by fundamental data. Note that our analysis may not factor in the latest price-sensitive company announcements or qualitative material. Simply Wall St has no position in any stocks mentioned.