
 Yahoo Finance
 Investors Could Be Concerned With Austal's (ASX:ASB) Returns On Capital
What trends should we look for it we want to identify stocks that can multiply in value over the long term? Ideally, a business will show two trends; firstly a growing return on capital employed (ROCE) and secondly, an increasing amount of capital employed. This shows us that it's a compounding machine, able to continually reinvest its earnings back into the business and generate higher returns. Having said that, from a first glance at Austal (ASX:ASB) we aren't jumping out of our chairs at how returns are trending, but let's have a deeper look.
What Is Return On Capital Employed (ROCE)?
For those that aren't sure what ROCE is, it measures the amount of pre-tax profits a company can generate from the capital employed in its business. To calculate this metric for Austal, this is the formula:
Return on Capital Employed = Earnings Before Interest and Tax (EBIT) ÷ (Total Assets - Current Liabilities)
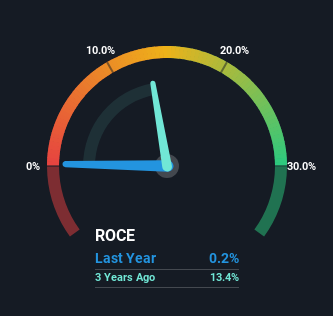
0.0017 = AU$2.4m ÷ (AU$1.9b - AU$542m) (Based on the trailing twelve months to December 2023).
So, Austal has an ROCE of 0.2%. In absolute terms, that's a low return and it also under-performs the Aerospace & Defense industry average of 8.2%.
View our latest analysis for Austal
In the above chart we have measured Austal's prior ROCE against its prior performance, but the future is arguably more important. If you're interested, you can view the analysts predictions in our free analyst report for Austal .
The Trend Of ROCE
When we looked at the ROCE trend at Austal, we didn't gain much confidence. Over the last five years, returns on capital have decreased to 0.2% from 7.8% five years ago. Meanwhile, the business is utilizing more capital but this hasn't moved the needle much in terms of sales in the past 12 months, so this could reflect longer term investments. It's worth keeping an eye on the company's earnings from here on to see if these investments do end up contributing to the bottom line.
The Key Takeaway
To conclude, we've found that Austal is reinvesting in the business, but returns have been falling. And with the stock having returned a mere 3.8% in the last five years to shareholders, you could argue that they're aware of these lackluster trends. As a result, if you're hunting for a multi-bagger, we think you'd have more luck elsewhere.
Austal does come with some risks though, we found 2 warning signs in our investment analysis, and 1 of those is a bit concerning...
If you want to search for solid companies with great earnings, check out this free list of companies with good balance sheets and impressive returns on equity.
Have feedback on this article? Concerned about the content? Get in touch with us directly. Alternatively, email editorial-team (at) simplywallst.com.
This article by Simply Wall St is general in nature. We provide commentary based on historical data and analyst forecasts only using an unbiased methodology and our articles are not intended to be financial advice. It does not constitute a recommendation to buy or sell any stock, and does not take account of your objectives, or your financial situation. We aim to bring you long-term focused analysis driven by fundamental data. Note that our analysis may not factor in the latest price-sensitive company announcements or qualitative material. Simply Wall St has no position in any stocks mentioned.
