
 Yahoo Finance
 Investors Continue Waiting On Sidelines For Anghami Inc. (NASDAQ:ANGH)
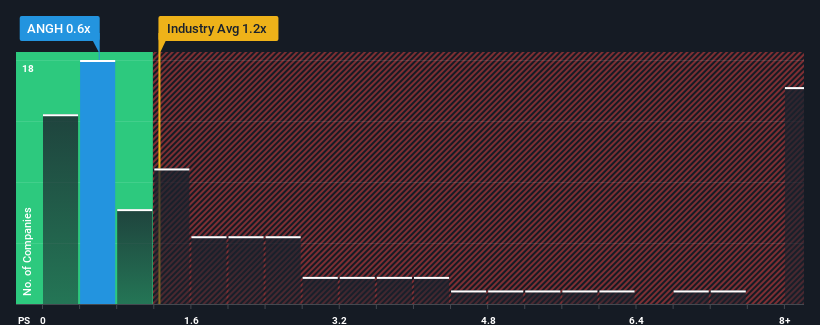
Anghami Inc.'s (NASDAQ:ANGH) price-to-sales (or "P/S") ratio of 0.6x may look like a pretty appealing investment opportunity when you consider close to half the companies in the Entertainment industry in the United States have P/S ratios greater than 1.2x. However, the P/S might be low for a reason and it requires further investigation to determine if it's justified.
Check out our latest analysis for Anghami
What Does Anghami's Recent Performance Look Like?
With revenue growth that's exceedingly strong of late, Anghami has been doing very well. It might be that many expect the strong revenue performance to degrade substantially, which has repressed the P/S ratio. If you like the company, you'd be hoping this isn't the case so that you could potentially pick up some stock while it's out of favour.
Want the full picture on earnings, revenue and cash flow for the company? Then our free report on Anghami will help you shine a light on its historical performance.
Is There Any Revenue Growth Forecasted For Anghami?
The only time you'd be truly comfortable seeing a P/S as low as Anghami's is when the company's growth is on track to lag the industry.
Taking a look back first, we see that the company grew revenue by an impressive 37% last year. The strong recent performance means it was also able to grow revenue by 55% in total over the last three years. So we can start by confirming that the company has done a great job of growing revenue over that time.
Comparing that to the industry, which is only predicted to deliver 10% growth in the next 12 months, the company's momentum is stronger based on recent medium-term annualised revenue results.
With this information, we find it odd that Anghami is trading at a P/S lower than the industry. Apparently some shareholders believe the recent performance has exceeded its limits and have been accepting significantly lower selling prices.
What Does Anghami's P/S Mean For Investors?
While the price-to-sales ratio shouldn't be the defining factor in whether you buy a stock or not, it's quite a capable barometer of revenue expectations.
We're very surprised to see Anghami currently trading on a much lower than expected P/S since its recent three-year growth is higher than the wider industry forecast. When we see robust revenue growth that outpaces the industry, we presume that there are notable underlying risks to the company's future performance, which is exerting downward pressure on the P/S ratio. At least price risks look to be very low if recent medium-term revenue trends continue, but investors seem to think future revenue could see a lot of volatility.
Plus, you should also learn about these 3 warning signs we've spotted with Anghami (including 2 which make us uncomfortable).
If you're unsure about the strength of Anghami's business, why not explore our interactive list of stocks with solid business fundamentals for some other companies you may have missed.
Have feedback on this article? Concerned about the content? Get in touch with us directly. Alternatively, email editorial-team (at) simplywallst.com.
This article by Simply Wall St is general in nature. We provide commentary based on historical data and analyst forecasts only using an unbiased methodology and our articles are not intended to be financial advice. It does not constitute a recommendation to buy or sell any stock, and does not take account of your objectives, or your financial situation. We aim to bring you long-term focused analysis driven by fundamental data. Note that our analysis may not factor in the latest price-sensitive company announcements or qualitative material. Simply Wall St has no position in any stocks mentioned.
