
 Yahoo Finance
 Investors Who Bought Nelnet (NYSE:NNI) Shares Three Years Ago Are Now Up 53%

It might be of some concern to shareholders to see the Nelnet, Inc. (NYSE:NNI) share price down 10% in the last month. But over the last three years returns have been decent. In that time the stock gained 53%, besting the market return of 46%.
View our latest analysis for Nelnet
While markets are a powerful pricing mechanism, share prices reflect investor sentiment, not just underlying business performance. One flawed but reasonable way to assess how sentiment around a company has changed is to compare the earnings per share (EPS) with the share price.
Over the last three years, Nelnet failed to grow earnings per share, which fell 12% (annualized).
This means it's unlikely the market is judging the company based on earnings growth. Since the change in EPS doesn't seem to correlate with the change in share price, it's worth taking a look at other metrics.
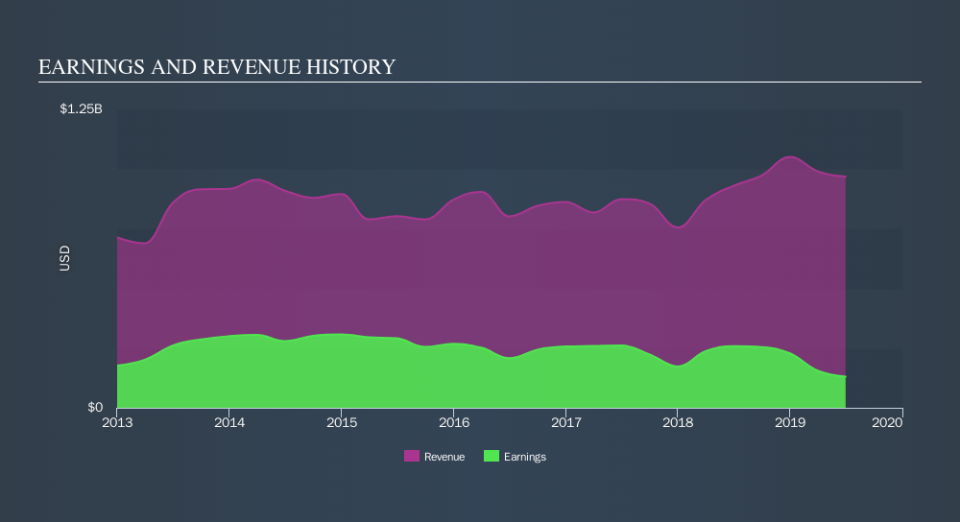
Languishing at just 1.2%, we doubt the dividend is doing much to prop up the share price. It may well be that Nelnet revenue growth rate of 7.6% over three years has convinced shareholders to believe in a brighter future. If the company is being managed for the long term good, today's shareholders might be right to hold on.
The company's revenue and earnings (over time) are depicted in the image below (click to see the exact numbers).
We're pleased to report that the CEO is remunerated more modestly than most CEOs at similarly capitalized companies. It's always worth keeping an eye on CEO pay, but a more important question is whether the company will grow earnings throughout the years. You can see what analysts are predicting for Nelnet in this interactive graph of future profit estimates.
What About Dividends?
As well as measuring the share price return, investors should also consider the total shareholder return (TSR). The TSR is a return calculation that accounts for the value of cash dividends (assuming that any dividend received was reinvested) and the calculated value of any discounted capital raisings and spin-offs. So for companies that pay a generous dividend, the TSR is often a lot higher than the share price return. As it happens, Nelnet's TSR for the last 3 years was 59%, which exceeds the share price return mentioned earlier. The dividends paid by the company have thusly boosted the total shareholder return.
A Different Perspective
Nelnet shareholders have received returns of 10% over twelve months (even including dividends) , which isn't far from the general market return. Most would be happy with a gain, and it helps that the year's return is actually better than the average return over five years, which was 7.1%. It is possible that management foresight will bring growth well into the future, even if the share price slows down. Before deciding if you like the current share price, check how Nelnet scores on these 3 valuation metrics.
But note: Nelnet may not be the best stock to buy. So take a peek at this free list of interesting companies with past earnings growth (and further growth forecast).
Please note, the market returns quoted in this article reflect the market weighted average returns of stocks that currently trade on US exchanges.
We aim to bring you long-term focused research analysis driven by fundamental data. Note that our analysis may not factor in the latest price-sensitive company announcements or qualitative material.
If you spot an error that warrants correction, please contact the editor at editorial-team@simplywallst.com. This article by Simply Wall St is general in nature. It does not constitute a recommendation to buy or sell any stock, and does not take account of your objectives, or your financial situation. Simply Wall St has no position in the stocks mentioned. Thank you for reading.
