
 Yahoo Finance
 Investors in AMP (ASX:AMP) have unfortunately lost 55% over the last five years
We think intelligent long term investing is the way to go. But along the way some stocks are going to perform badly. For example, after five long years the AMP Limited (ASX:AMP) share price is a whole 60% lower. That is extremely sub-optimal, to say the least. And we doubt long term believers are the only worried holders, since the stock price has declined 29% over the last twelve months.
Now let's have a look at the company's fundamentals, and see if the long term shareholder return has matched the performance of the underlying business.
Check out our latest analysis for AMP
AMP isn't currently profitable, so most analysts would look to revenue growth to get an idea of how fast the underlying business is growing. Shareholders of unprofitable companies usually expect strong revenue growth. As you can imagine, fast revenue growth, when maintained, often leads to fast profit growth.
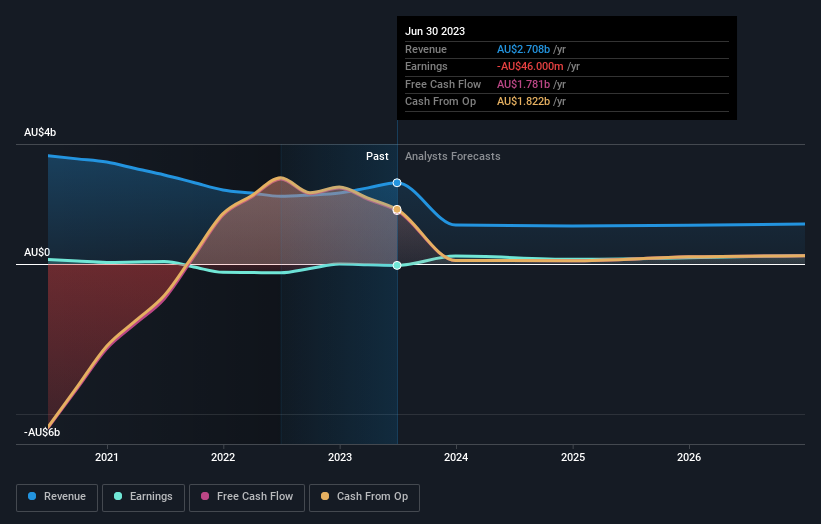
In the last five years AMP saw its revenue shrink by 39% per year. That's definitely a weaker result than most pre-profit companies report. Arguably, the market has responded appropriately to this business performance by sending the share price down 10% (annualized) in the same time period. We don't generally like to own companies that lose money and don't grow revenues. You might be better off spending your money on a leisure activity. You'd want to research this company pretty thoroughly before buying, it looks a bit too risky for us.
The image below shows how earnings and revenue have tracked over time (if you click on the image you can see greater detail).
You can see how its balance sheet has strengthened (or weakened) over time in this free interactive graphic.
What About Dividends?
It is important to consider the total shareholder return, as well as the share price return, for any given stock. The TSR incorporates the value of any spin-offs or discounted capital raisings, along with any dividends, based on the assumption that the dividends are reinvested. Arguably, the TSR gives a more comprehensive picture of the return generated by a stock. We note that for AMP the TSR over the last 5 years was -55%, which is better than the share price return mentioned above. And there's no prize for guessing that the dividend payments largely explain the divergence!
A Different Perspective
AMP shareholders are down 25% for the year (even including dividends), but the market itself is up 6.4%. Even the share prices of good stocks drop sometimes, but we want to see improvements in the fundamental metrics of a business, before getting too interested. Regrettably, last year's performance caps off a bad run, with the shareholders facing a total loss of 9% per year over five years. We realise that Baron Rothschild has said investors should "buy when there is blood on the streets", but we caution that investors should first be sure they are buying a high quality business. It's always interesting to track share price performance over the longer term. But to understand AMP better, we need to consider many other factors. For example, we've discovered 2 warning signs for AMP (1 makes us a bit uncomfortable!) that you should be aware of before investing here.
Of course, you might find a fantastic investment by looking elsewhere. So take a peek at this free list of companies we expect will grow earnings.
Please note, the market returns quoted in this article reflect the market weighted average returns of stocks that currently trade on Australian exchanges.
Have feedback on this article? Concerned about the content? Get in touch with us directly. Alternatively, email editorial-team (at) simplywallst.com.
This article by Simply Wall St is general in nature. We provide commentary based on historical data and analyst forecasts only using an unbiased methodology and our articles are not intended to be financial advice. It does not constitute a recommendation to buy or sell any stock, and does not take account of your objectives, or your financial situation. We aim to bring you long-term focused analysis driven by fundamental data. Note that our analysis may not factor in the latest price-sensitive company announcements or qualitative material. Simply Wall St has no position in any stocks mentioned.
