
 Yahoo Finance
 Investing in TE Connectivity (NYSE:TEL) three years ago would have delivered you a 46% gain
By buying an index fund, investors can approximate the average market return. But if you pick the right individual stocks, you could make more than that. For example, the TE Connectivity Ltd. (NYSE:TEL) share price is up 39% in the last three years, clearly besting the market return of around 29% (not including dividends).
Let's take a look at the underlying fundamentals over the longer term, and see if they've been consistent with shareholders returns.
View our latest analysis for TE Connectivity
To paraphrase Benjamin Graham: Over the short term the market is a voting machine, but over the long term it's a weighing machine. One imperfect but simple way to consider how the market perception of a company has shifted is to compare the change in the earnings per share (EPS) with the share price movement.
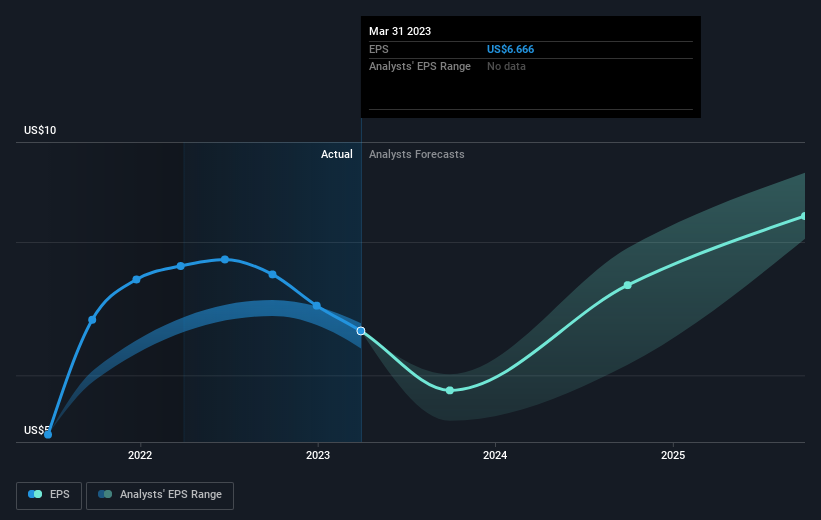
TE Connectivity was able to grow its EPS at 47% per year over three years, sending the share price higher. This EPS growth is higher than the 12% average annual increase in the share price. Therefore, it seems the market has moderated its expectations for growth, somewhat.
You can see below how EPS has changed over time (discover the exact values by clicking on the image).
We know that TE Connectivity has improved its bottom line over the last three years, but what does the future have in store? Take a more thorough look at TE Connectivity's financial health with this free report on its balance sheet.
What About Dividends?
As well as measuring the share price return, investors should also consider the total shareholder return (TSR). The TSR is a return calculation that accounts for the value of cash dividends (assuming that any dividend received was reinvested) and the calculated value of any discounted capital raisings and spin-offs. It's fair to say that the TSR gives a more complete picture for stocks that pay a dividend. As it happens, TE Connectivity's TSR for the last 3 years was 46%, which exceeds the share price return mentioned earlier. This is largely a result of its dividend payments!
A Different Perspective
While the broader market gained around 4.2% in the last year, TE Connectivity shareholders lost 1.2% (even including dividends). Even the share prices of good stocks drop sometimes, but we want to see improvements in the fundamental metrics of a business, before getting too interested. On the bright side, long term shareholders have made money, with a gain of 7% per year over half a decade. If the fundamental data continues to indicate long term sustainable growth, the current sell-off could be an opportunity worth considering. It's always interesting to track share price performance over the longer term. But to understand TE Connectivity better, we need to consider many other factors. To that end, you should be aware of the 1 warning sign we've spotted with TE Connectivity .
If you would prefer to check out another company -- one with potentially superior financials -- then do not miss this free list of companies that have proven they can grow earnings.
Please note, the market returns quoted in this article reflect the market weighted average returns of stocks that currently trade on American exchanges.
Have feedback on this article? Concerned about the content? Get in touch with us directly. Alternatively, email editorial-team (at) simplywallst.com.
This article by Simply Wall St is general in nature. We provide commentary based on historical data and analyst forecasts only using an unbiased methodology and our articles are not intended to be financial advice. It does not constitute a recommendation to buy or sell any stock, and does not take account of your objectives, or your financial situation. We aim to bring you long-term focused analysis driven by fundamental data. Note that our analysis may not factor in the latest price-sensitive company announcements or qualitative material. Simply Wall St has no position in any stocks mentioned.
Join A Paid User Research Session
You’ll receive a US$30 Amazon Gift card for 1 hour of your time while helping us build better investing tools for the individual investors like yourself. Sign up here
