
 Yahoo Finance
 Investing in REA Group (ASX:REA) five years ago would have delivered you a 109% gain
Stock pickers are generally looking for stocks that will outperform the broader market. Buying under-rated businesses is one path to excess returns. To wit, the REA Group share price has climbed 98% in five years, easily topping the market return of 21% (ignoring dividends). On the other hand, the more recent gains haven't been so impressive, with shareholders gaining just 36%, including dividends.
So let's investigate and see if the longer term performance of the company has been in line with the underlying business' progress.
View our latest analysis for REA Group
In his essay The Superinvestors of Graham-and-Doddsville Warren Buffett described how share prices do not always rationally reflect the value of a business. By comparing earnings per share (EPS) and share price changes over time, we can get a feel for how investor attitudes to a company have morphed over time.
Over half a decade, REA Group managed to grow its earnings per share at 18% a year. The EPS growth is more impressive than the yearly share price gain of 15% over the same period. So it seems the market isn't so enthusiastic about the stock these days. Having said that, the market is still optimistic, given the P/E ratio of 85.87.
The image below shows how EPS has tracked over time (if you click on the image you can see greater detail).
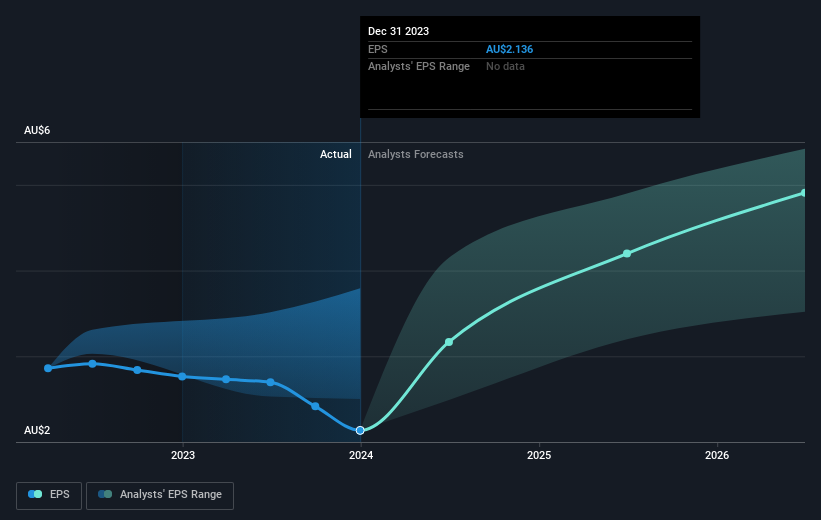
This free interactive report on REA Group's earnings, revenue and cash flow is a great place to start, if you want to investigate the stock further.
What About Dividends?
When looking at investment returns, it is important to consider the difference between total shareholder return (TSR) and share price return. Whereas the share price return only reflects the change in the share price, the TSR includes the value of dividends (assuming they were reinvested) and the benefit of any discounted capital raising or spin-off. Arguably, the TSR gives a more comprehensive picture of the return generated by a stock. We note that for REA Group the TSR over the last 5 years was 109%, which is better than the share price return mentioned above. The dividends paid by the company have thusly boosted the total shareholder return.
A Different Perspective
We're pleased to report that REA Group shareholders have received a total shareholder return of 36% over one year. Of course, that includes the dividend. That's better than the annualised return of 16% over half a decade, implying that the company is doing better recently. In the best case scenario, this may hint at some real business momentum, implying that now could be a great time to delve deeper. I find it very interesting to look at share price over the long term as a proxy for business performance. But to truly gain insight, we need to consider other information, too. For instance, we've identified 1 warning sign for REA Group that you should be aware of.
For those who like to find winning investments this free list of undervalued companies with recent insider purchasing, could be just the ticket.
Please note, the market returns quoted in this article reflect the market weighted average returns of stocks that currently trade on Australian exchanges.
Have feedback on this article? Concerned about the content? Get in touch with us directly. Alternatively, email editorial-team (at) simplywallst.com.
This article by Simply Wall St is general in nature. We provide commentary based on historical data and analyst forecasts only using an unbiased methodology and our articles are not intended to be financial advice. It does not constitute a recommendation to buy or sell any stock, and does not take account of your objectives, or your financial situation. We aim to bring you long-term focused analysis driven by fundamental data. Note that our analysis may not factor in the latest price-sensitive company announcements or qualitative material. Simply Wall St has no position in any stocks mentioned.
