
 Yahoo Finance
 Investing in Medacta Group (VTX:MOVE) a year ago would have delivered you a 24% gain
If you want to compound wealth in the stock market, you can do so by buying an index fund. But one can do better than that by picking better than average stocks (as part of a diversified portfolio). For example, the Medacta Group SA (VTX:MOVE) share price is up 24% in the last 1 year, clearly besting the market return of around 2.4% (not including dividends). So that should have shareholders smiling. Having said that, the longer term returns aren't so impressive, with stock gaining just 17% in three years.
So let's investigate and see if the longer term performance of the company has been in line with the underlying business' progress.
Check out our latest analysis for Medacta Group
While the efficient markets hypothesis continues to be taught by some, it has been proven that markets are over-reactive dynamic systems, and investors are not always rational. One flawed but reasonable way to assess how sentiment around a company has changed is to compare the earnings per share (EPS) with the share price.
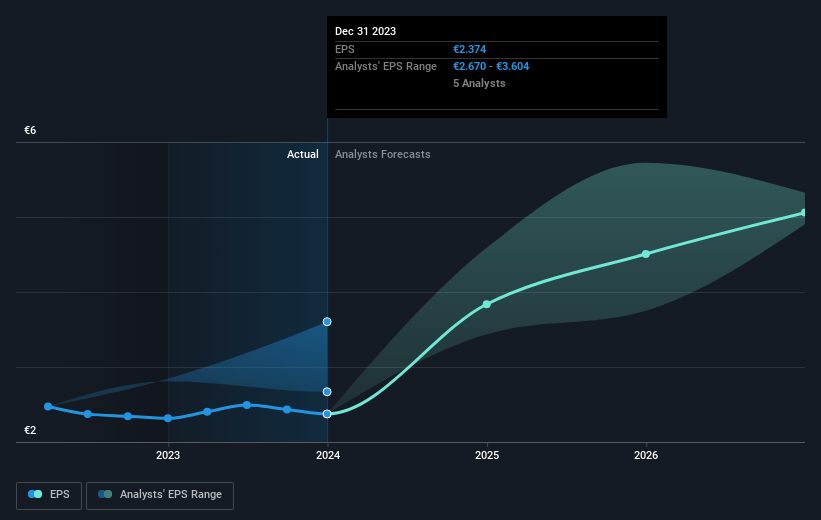
During the last year Medacta Group grew its earnings per share (EPS) by 2.5%. This EPS growth is significantly lower than the 24% increase in the share price. This indicates that the market is now more optimistic about the stock. This favorable sentiment is reflected in its (fairly optimistic) P/E ratio of 52.97.
You can see below how EPS has changed over time (discover the exact values by clicking on the image).
This free interactive report on Medacta Group's earnings, revenue and cash flow is a great place to start, if you want to investigate the stock further.
A Different Perspective
We're pleased to report that Medacta Group shareholders have received a total shareholder return of 24% over one year. And that does include the dividend. That gain is better than the annual TSR over five years, which is 4%. Therefore it seems like sentiment around the company has been positive lately. Given the share price momentum remains strong, it might be worth taking a closer look at the stock, lest you miss an opportunity. While it is well worth considering the different impacts that market conditions can have on the share price, there are other factors that are even more important. Case in point: We've spotted 1 warning sign for Medacta Group you should be aware of.
We will like Medacta Group better if we see some big insider buys. While we wait, check out this free list of growing companies with considerable, recent, insider buying.
Please note, the market returns quoted in this article reflect the market weighted average returns of stocks that currently trade on Swiss exchanges.
Have feedback on this article? Concerned about the content? Get in touch with us directly. Alternatively, email editorial-team (at) simplywallst.com.
This article by Simply Wall St is general in nature. We provide commentary based on historical data and analyst forecasts only using an unbiased methodology and our articles are not intended to be financial advice. It does not constitute a recommendation to buy or sell any stock, and does not take account of your objectives, or your financial situation. We aim to bring you long-term focused analysis driven by fundamental data. Note that our analysis may not factor in the latest price-sensitive company announcements or qualitative material. Simply Wall St has no position in any stocks mentioned.
