
 Yahoo Finance
 Investing in Ellington Financial (NYSE:EFC) five years ago would have delivered you a 6.7% gain
For many, the main point of investing is to generate higher returns than the overall market. But every investor is virtually certain to have both over-performing and under-performing stocks. So we wouldn't blame long term Ellington Financial Inc. (NYSE:EFC) shareholders for doubting their decision to hold, with the stock down 39% over a half decade. Shareholders have had an even rougher run lately, with the share price down 13% in the last 90 days.
So let's have a look and see if the longer term performance of the company has been in line with the underlying business' progress.
View our latest analysis for Ellington Financial
To paraphrase Benjamin Graham: Over the short term the market is a voting machine, but over the long term it's a weighing machine. One flawed but reasonable way to assess how sentiment around a company has changed is to compare the earnings per share (EPS) with the share price.
During five years of share price growth, Ellington Financial moved from a loss to profitability. That would generally be considered a positive, so we are surprised to see the share price is down. Other metrics may better explain the share price move.
We note that the dividend has remained healthy, so that wouldn't really explain the share price drop. It's not immediately clear to us why the stock price is down but further research might provide some answers.
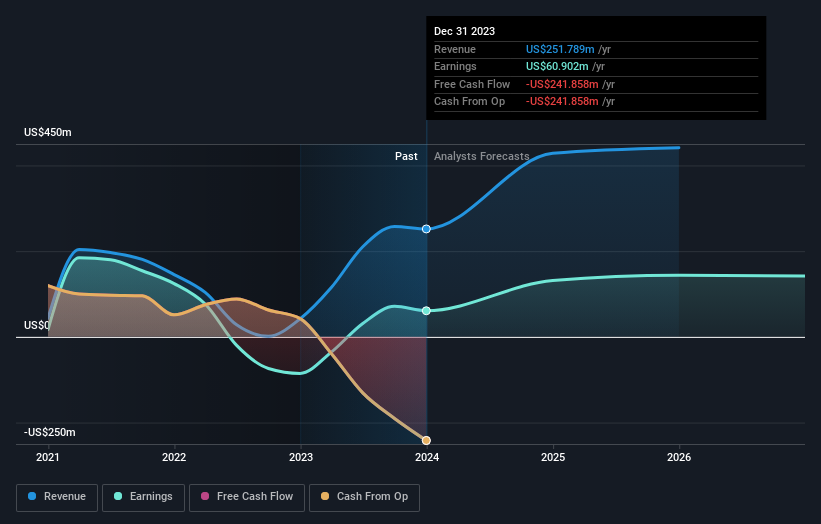
You can see below how earnings and revenue have changed over time (discover the exact values by clicking on the image).
We know that Ellington Financial has improved its bottom line lately, but what does the future have in store? If you are thinking of buying or selling Ellington Financial stock, you should check out this free report showing analyst profit forecasts.
What About Dividends?
It is important to consider the total shareholder return, as well as the share price return, for any given stock. The TSR incorporates the value of any spin-offs or discounted capital raisings, along with any dividends, based on the assumption that the dividends are reinvested. It's fair to say that the TSR gives a more complete picture for stocks that pay a dividend. In the case of Ellington Financial, it has a TSR of 6.7% for the last 5 years. That exceeds its share price return that we previously mentioned. This is largely a result of its dividend payments!
A Different Perspective
Ellington Financial provided a TSR of 3.8% over the last twelve months. Unfortunately this falls short of the market return. The silver lining is that the gain was actually better than the average annual return of 1.3% per year over five year. It is possible that returns will improve along with the business fundamentals. While it is well worth considering the different impacts that market conditions can have on the share price, there are other factors that are even more important. Even so, be aware that Ellington Financial is showing 3 warning signs in our investment analysis , and 2 of those are a bit unpleasant...
If you like to buy stocks alongside management, then you might just love this free list of companies. (Hint: insiders have been buying them).
Please note, the market returns quoted in this article reflect the market weighted average returns of stocks that currently trade on American exchanges.
Have feedback on this article? Concerned about the content? Get in touch with us directly. Alternatively, email editorial-team (at) simplywallst.com.
This article by Simply Wall St is general in nature. We provide commentary based on historical data and analyst forecasts only using an unbiased methodology and our articles are not intended to be financial advice. It does not constitute a recommendation to buy or sell any stock, and does not take account of your objectives, or your financial situation. We aim to bring you long-term focused analysis driven by fundamental data. Note that our analysis may not factor in the latest price-sensitive company announcements or qualitative material. Simply Wall St has no position in any stocks mentioned.
