
 Yahoo Finance
 Investing in Cyclopharm (ASX:CYC) five years ago would have delivered you a 141% gain
When you buy shares in a company, it's worth keeping in mind the possibility that it could fail, and you could lose your money. But on the bright side, you can make far more than 100% on a really good stock. For example, the Cyclopharm Limited (ASX:CYC) share price has soared 133% in the last half decade. Most would be very happy with that. It's also good to see the share price up 11% over the last quarter.
Let's take a look at the underlying fundamentals over the longer term, and see if they've been consistent with shareholders returns.
Check out our latest analysis for Cyclopharm
Given that Cyclopharm didn't make a profit in the last twelve months, we'll focus on revenue growth to form a quick view of its business development. When a company doesn't make profits, we'd generally expect to see good revenue growth. That's because fast revenue growth can be easily extrapolated to forecast profits, often of considerable size.
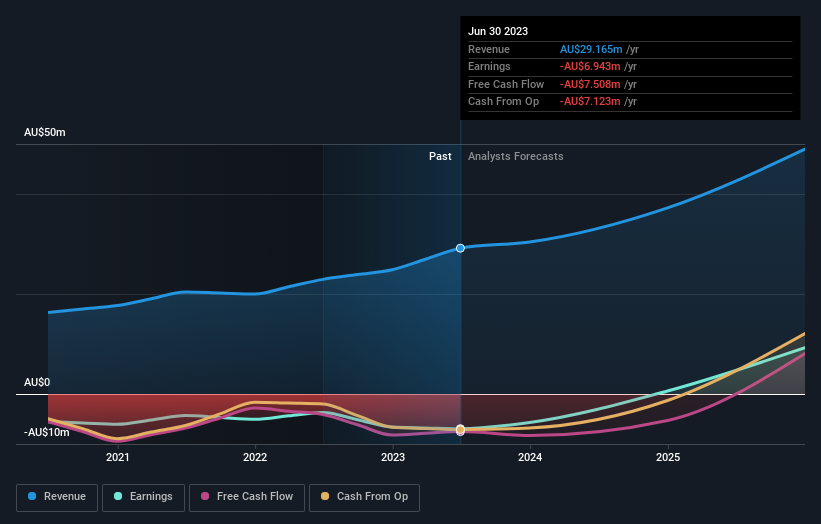
For the last half decade, Cyclopharm can boast revenue growth at a rate of 13% per year. That's a fairly respectable growth rate. We'd argue this growth has been reflected in the share price which has climbed at a rate of 18% per year over in that time. Given that the business has made good progress on the top line, it would be worth taking a look at the growth trend. Accelerating growth can be a sign of an inflection point - and could indicate profits lie ahead. Worth watching 100%
You can see below how earnings and revenue have changed over time (discover the exact values by clicking on the image).
This free interactive report on Cyclopharm's balance sheet strength is a great place to start, if you want to investigate the stock further.
What About Dividends?
As well as measuring the share price return, investors should also consider the total shareholder return (TSR). Whereas the share price return only reflects the change in the share price, the TSR includes the value of dividends (assuming they were reinvested) and the benefit of any discounted capital raising or spin-off. Arguably, the TSR gives a more comprehensive picture of the return generated by a stock. In the case of Cyclopharm, it has a TSR of 141% for the last 5 years. That exceeds its share price return that we previously mentioned. The dividends paid by the company have thusly boosted the total shareholder return.
A Different Perspective
We're pleased to report that Cyclopharm shareholders have received a total shareholder return of 64% over one year. That's including the dividend. That's better than the annualised return of 19% over half a decade, implying that the company is doing better recently. Given the share price momentum remains strong, it might be worth taking a closer look at the stock, lest you miss an opportunity. If you would like to research Cyclopharm in more detail then you might want to take a look at whether insiders have been buying or selling shares in the company.
If you are like me, then you will not want to miss this free list of growing companies that insiders are buying.
Please note, the market returns quoted in this article reflect the market weighted average returns of stocks that currently trade on Australian exchanges.
Have feedback on this article? Concerned about the content? Get in touch with us directly. Alternatively, email editorial-team (at) simplywallst.com.
This article by Simply Wall St is general in nature. We provide commentary based on historical data and analyst forecasts only using an unbiased methodology and our articles are not intended to be financial advice. It does not constitute a recommendation to buy or sell any stock, and does not take account of your objectives, or your financial situation. We aim to bring you long-term focused analysis driven by fundamental data. Note that our analysis may not factor in the latest price-sensitive company announcements or qualitative material. Simply Wall St has no position in any stocks mentioned.
