
 Yahoo Finance
 Investing in Brighthouse Financial (NASDAQ:BHF) five years ago would have delivered you a 28% gain
When you buy and hold a stock for the long term, you definitely want it to provide a positive return. But more than that, you probably want to see it rise more than the market average. But Brighthouse Financial, Inc. (NASDAQ:BHF) has fallen short of that second goal, with a share price rise of 28% over five years, which is below the market return. Some buyers are laughing, though, with an increase of 22% in the last year.
So let's investigate and see if the longer term performance of the company has been in line with the underlying business' progress.
Check out our latest analysis for Brighthouse Financial
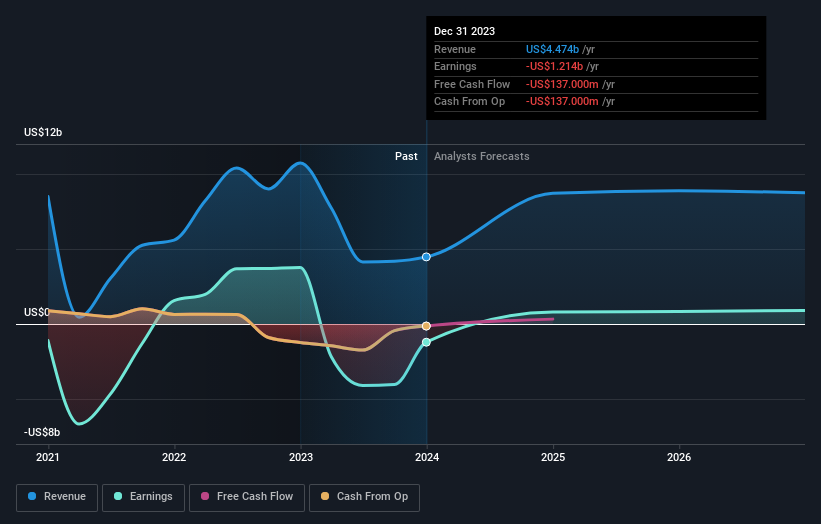
Brighthouse Financial wasn't profitable in the last twelve months, it is unlikely we'll see a strong correlation between its share price and its earnings per share (EPS). Arguably revenue is our next best option. Shareholders of unprofitable companies usually desire strong revenue growth. That's because fast revenue growth can be easily extrapolated to forecast profits, often of considerable size.
In the last 5 years Brighthouse Financial saw its revenue shrink by 9.5% per year. The stock is only up 5% for each year during the period. Arguably that's not bad given the soft revenue and loss-making position. We'd keep an eye on changes in the trend - there may be an opportunity if the company returns to growth.
The image below shows how earnings and revenue have tracked over time (if you click on the image you can see greater detail).
This free interactive report on Brighthouse Financial's balance sheet strength is a great place to start, if you want to investigate the stock further.
A Different Perspective
Brighthouse Financial shareholders are up 22% for the year. But that return falls short of the market. The silver lining is that the gain was actually better than the average annual return of 5% per year over five year. This could indicate that the company is winning over new investors, as it pursues its strategy. While it is well worth considering the different impacts that market conditions can have on the share price, there are other factors that are even more important. Consider for instance, the ever-present spectre of investment risk. We've identified 1 warning sign with Brighthouse Financial , and understanding them should be part of your investment process.
If you are like me, then you will not want to miss this free list of growing companies that insiders are buying.
Please note, the market returns quoted in this article reflect the market weighted average returns of stocks that currently trade on American exchanges.
Have feedback on this article? Concerned about the content? Get in touch with us directly. Alternatively, email editorial-team (at) simplywallst.com.
This article by Simply Wall St is general in nature. We provide commentary based on historical data and analyst forecasts only using an unbiased methodology and our articles are not intended to be financial advice. It does not constitute a recommendation to buy or sell any stock, and does not take account of your objectives, or your financial situation. We aim to bring you long-term focused analysis driven by fundamental data. Note that our analysis may not factor in the latest price-sensitive company announcements or qualitative material. Simply Wall St has no position in any stocks mentioned.
