
 Yahoo Finance
 Introducing Comerica (NYSE:CMA), The Stock That Dropped 39% In The Last Year

Investors can approximate the average market return by buying an index fund. But if you buy individual stocks, you can do both better or worse than that. That downside risk was realized by Comerica Incorporated (NYSE:CMA) shareholders over the last year, as the share price declined 39%. That contrasts poorly with the market return of 1.6%. On the bright side, the stock is actually up 33% in the last three years. Furthermore, it's down 17% in about a quarter. That's not much fun for holders. We note that the company has reported results fairly recently; and the market is hardly delighted. You can check out the latest numbers in our company report.
See our latest analysis for Comerica
In his essay The Superinvestors of Graham-and-Doddsville Warren Buffett described how share prices do not always rationally reflect the value of a business. By comparing earnings per share (EPS) and share price changes over time, we can get a feel for how investor attitudes to a company have morphed over time.
Even though the Comerica share price is down over the year, its EPS actually improved. Of course, the situation might betray previous over-optimism about growth. It's surprising to see the share price fall so much, despite the improved EPS. But we might find some different metrics explain the share price movements better.
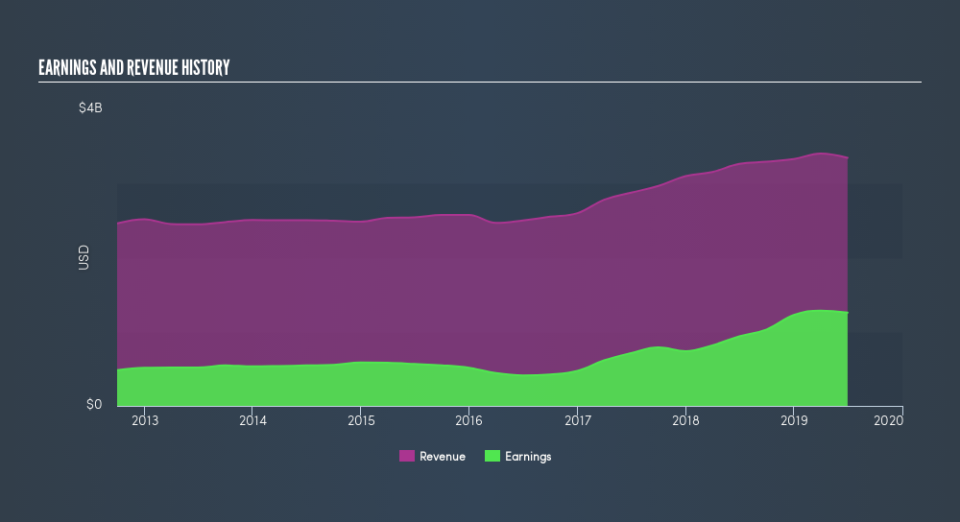
We don't see any weakness in the Comerica's dividend so the steady payout can't really explain the share price drop. From what we can see, revenue is pretty flat, so that doesn't really explain the share price drop. Of course, it could simply be that it simply fell short of the market consensus expectations.
The image below shows how earnings and revenue have tracked over time (if you click on the image you can see greater detail).
We're pleased to report that the CEO is remunerated more modestly than most CEOs at similarly capitalized companies. It's always worth keeping an eye on CEO pay, but a more important question is whether the company will grow earnings throughout the years. So we recommend checking out this free report showing consensus forecasts
What About Dividends?
It is important to consider the total shareholder return, as well as the share price return, for any given stock. The TSR incorporates the value of any spin-offs or discounted capital raisings, along with any dividends, based on the assumption that the dividends are reinvested. It's fair to say that the TSR gives a more complete picture for stocks that pay a dividend. We note that for Comerica the TSR over the last year was -37%, which is better than the share price return mentioned above. This is largely a result of its dividend payments!
A Different Perspective
Comerica shareholders are down 37% for the year (even including dividends), but the market itself is up 1.6%. Even the share prices of good stocks drop sometimes, but we want to see improvements in the fundamental metrics of a business, before getting too interested. On the bright side, long term shareholders have made money, with a gain of 5.8% per year over half a decade. If the fundamental data continues to indicate long term sustainable growth, the current sell-off could be an opportunity worth considering. Before spending more time on Comerica it might be wise to click here to see if insiders have been buying or selling shares.
Of course Comerica may not be the best stock to buy. So you may wish to see this free collection of growth stocks.
Please note, the market returns quoted in this article reflect the market weighted average returns of stocks that currently trade on US exchanges.
We aim to bring you long-term focused research analysis driven by fundamental data. Note that our analysis may not factor in the latest price-sensitive company announcements or qualitative material.
If you spot an error that warrants correction, please contact the editor at editorial-team@simplywallst.com. This article by Simply Wall St is general in nature. It does not constitute a recommendation to buy or sell any stock, and does not take account of your objectives, or your financial situation. Simply Wall St has no position in the stocks mentioned. Thank you for reading.
