
 Yahoo Finance
 InterDigital (NASDAQ:IDCC) Is Finding It Tricky To Allocate Its Capital
Ignoring the stock price of a company, what are the underlying trends that tell us a business is past the growth phase? A business that's potentially in decline often shows two trends, a return on capital employed (ROCE) that's declining, and a base of capital employed that's also declining. Trends like this ultimately mean the business is reducing its investments and also earning less on what it has invested. In light of that, from a first glance at InterDigital (NASDAQ:IDCC), we've spotted some signs that it could be struggling, so let's investigate.
Understanding Return On Capital Employed (ROCE)
If you haven't worked with ROCE before, it measures the 'return' (pre-tax profit) a company generates from capital employed in its business. The formula for this calculation on InterDigital is:
Return on Capital Employed = Earnings Before Interest and Tax (EBIT) ÷ (Total Assets - Current Liabilities)
0.032 = US$41m ÷ (US$1.5b - US$234m) (Based on the trailing twelve months to June 2021).
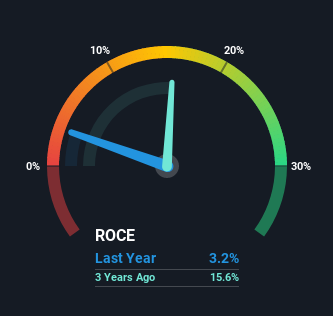
So, InterDigital has an ROCE of 3.2%. Ultimately, that's a low return and it under-performs the Software industry average of 10%.
View our latest analysis for InterDigital
Above you can see how the current ROCE for InterDigital compares to its prior returns on capital, but there's only so much you can tell from the past. If you'd like to see what analysts are forecasting going forward, you should check out our free report for InterDigital.
What Can We Tell From InterDigital's ROCE Trend?
We are a bit worried about the trend of returns on capital at InterDigital. To be more specific, the ROCE was 16% five years ago, but since then it has dropped noticeably. And on the capital employed front, the business is utilizing roughly the same amount of capital as it was back then. This combination can be indicative of a mature business that still has areas to deploy capital, but the returns received aren't as high due potentially to new competition or smaller margins. If these trends continue, we wouldn't expect InterDigital to turn into a multi-bagger.
The Key Takeaway
In summary, it's unfortunate that InterDigital is generating lower returns from the same amount of capital. And, the stock has remained flat over the last five years, so investors don't seem too impressed either. Unless there is a shift to a more positive trajectory in these metrics, we would look elsewhere.
One more thing: We've identified 3 warning signs with InterDigital (at least 1 which doesn't sit too well with us) , and understanding these would certainly be useful.
While InterDigital may not currently earn the highest returns, we've compiled a list of companies that currently earn more than 25% return on equity. Check out this free list here.
This article by Simply Wall St is general in nature. We provide commentary based on historical data and analyst forecasts only using an unbiased methodology and our articles are not intended to be financial advice. It does not constitute a recommendation to buy or sell any stock, and does not take account of your objectives, or your financial situation. We aim to bring you long-term focused analysis driven by fundamental data. Note that our analysis may not factor in the latest price-sensitive company announcements or qualitative material. Simply Wall St has no position in any stocks mentioned.
Have feedback on this article? Concerned about the content? Get in touch with us directly. Alternatively, email editorial-team (at) simplywallst.com.
