
 Yahoo Finance
 Integrated Research (ASX:IRI) earnings and shareholder returns have been trending downwards for the last five years, but the stock soars 44% this past week
Integrated Research Limited (ASX:IRI) shareholders are doubtless heartened to see the share price bounce 44% in just one week. But will that repair the damage for the weary investors who have owned this stock as it declined over half a decade? Probably not. Five years have seen the share price descend precipitously, down a full 87%. The recent bounce might mean the long decline is over, but we are not confident. The million dollar question is whether the company can justify a long term recovery. While a drop like that is definitely a body blow, money isn't as important as health and happiness.
While the stock has risen 44% in the past week but long term shareholders are still in the red, let's see what the fundamentals can tell us.
See our latest analysis for Integrated Research
There is no denying that markets are sometimes efficient, but prices do not always reflect underlying business performance. One imperfect but simple way to consider how the market perception of a company has shifted is to compare the change in the earnings per share (EPS) with the share price movement.
During the five years over which the share price declined, Integrated Research's earnings per share (EPS) dropped by 39% each year. This change in EPS is reasonably close to the 33% average annual decrease in the share price. This suggests that market participants have not changed their view of the company all that much. Rather, the share price has approximately tracked EPS growth.
You can see how EPS has changed over time in the image below (click on the chart to see the exact values).
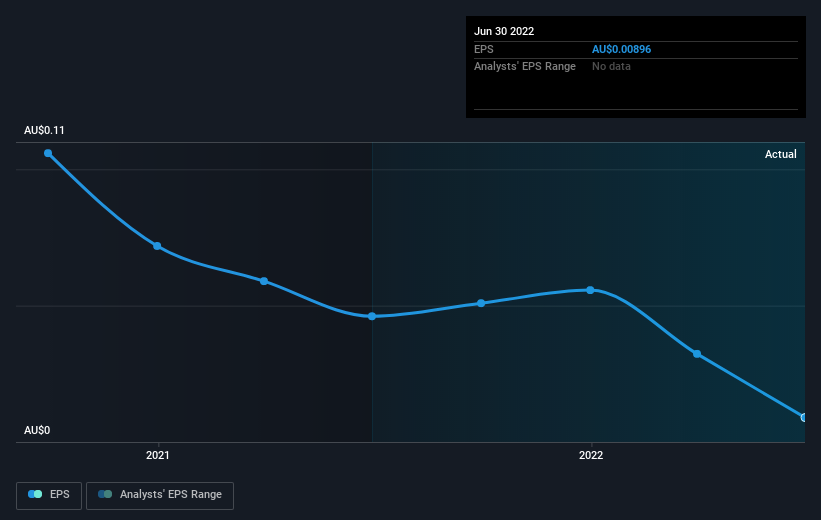
It might be well worthwhile taking a look at our free report on Integrated Research's earnings, revenue and cash flow.
A Different Perspective
Integrated Research shareholders are down 59% for the year, but the market itself is up 0.4%. However, keep in mind that even the best stocks will sometimes underperform the market over a twelve month period. Regrettably, last year's performance caps off a bad run, with the shareholders facing a total loss of 13% per year over five years. Generally speaking long term share price weakness can be a bad sign, though contrarian investors might want to research the stock in hope of a turnaround. While it is well worth considering the different impacts that market conditions can have on the share price, there are other factors that are even more important. Consider for instance, the ever-present spectre of investment risk. We've identified 5 warning signs with Integrated Research (at least 1 which makes us a bit uncomfortable) , and understanding them should be part of your investment process.
If you are like me, then you will not want to miss this free list of growing companies that insiders are buying.
Please note, the market returns quoted in this article reflect the market weighted average returns of stocks that currently trade on AU exchanges.
Have feedback on this article? Concerned about the content? Get in touch with us directly. Alternatively, email editorial-team (at) simplywallst.com.
This article by Simply Wall St is general in nature. We provide commentary based on historical data and analyst forecasts only using an unbiased methodology and our articles are not intended to be financial advice. It does not constitute a recommendation to buy or sell any stock, and does not take account of your objectives, or your financial situation. We aim to bring you long-term focused analysis driven by fundamental data. Note that our analysis may not factor in the latest price-sensitive company announcements or qualitative material. Simply Wall St has no position in any stocks mentioned.
Join A Paid User Research Session
You’ll receive a US$30 Amazon Gift card for 1 hour of your time while helping us build better investing tools for the individual investors like yourself. Sign up here
