
 Yahoo Finance
 Insurance Australia Group Ltd's Dividend Analysis
Assessing the Upcoming Dividend and Historical Performance
Insurance Australia Group Ltd (IAUGY) recently announced a dividend of $0.33 per share, payable on 2024-04-11, with the ex-dividend date set for 2024-02-23. As investors look forward to this upcoming payment, the spotlight also shines on the company's dividend history, yield, and growth rates. Using the data from GuruFocus, let's look into Insurance Australia Group Ltd's dividend performance and assess its sustainability.
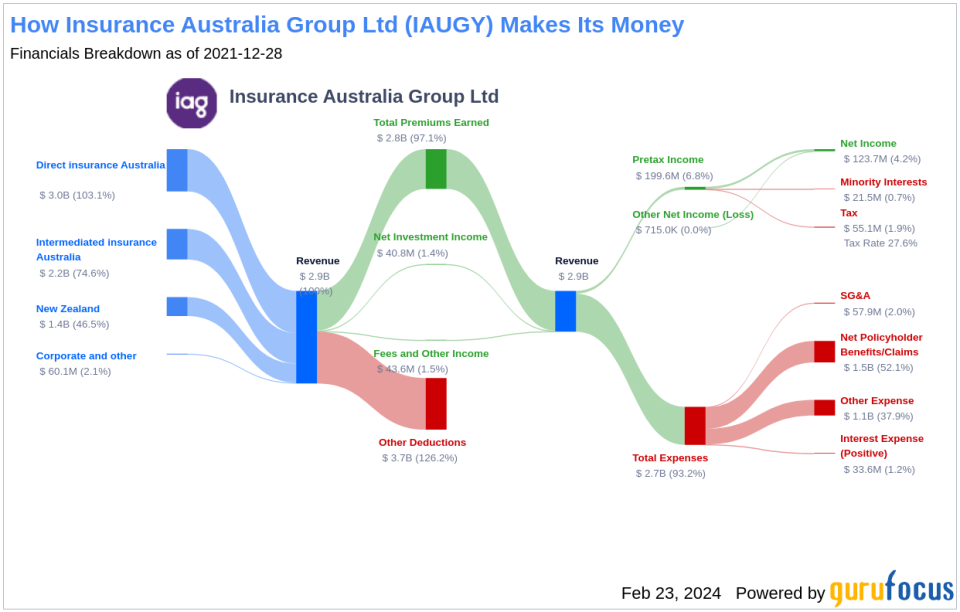
What Does Insurance Australia Group Ltd Do?
This Powerful Chart Made Peter Lynch 29% A Year For 13 Years
How to calculate the intrinsic value of a stock?
Insurance Australia Group is the biggest domestic general insurer by gross written premium operating in Australia and New Zealand. The key general insurance markets in which the company operates are home and contents, motor vehicle and compulsory third-party, and short-tail commercial. Insurance Australia Group sells insurance under several brands, including NRMA, CGU, SGIO, SGIC, WFI, and Swann in Australia, and NZI, State, AMI, and Lumley in New Zealand.
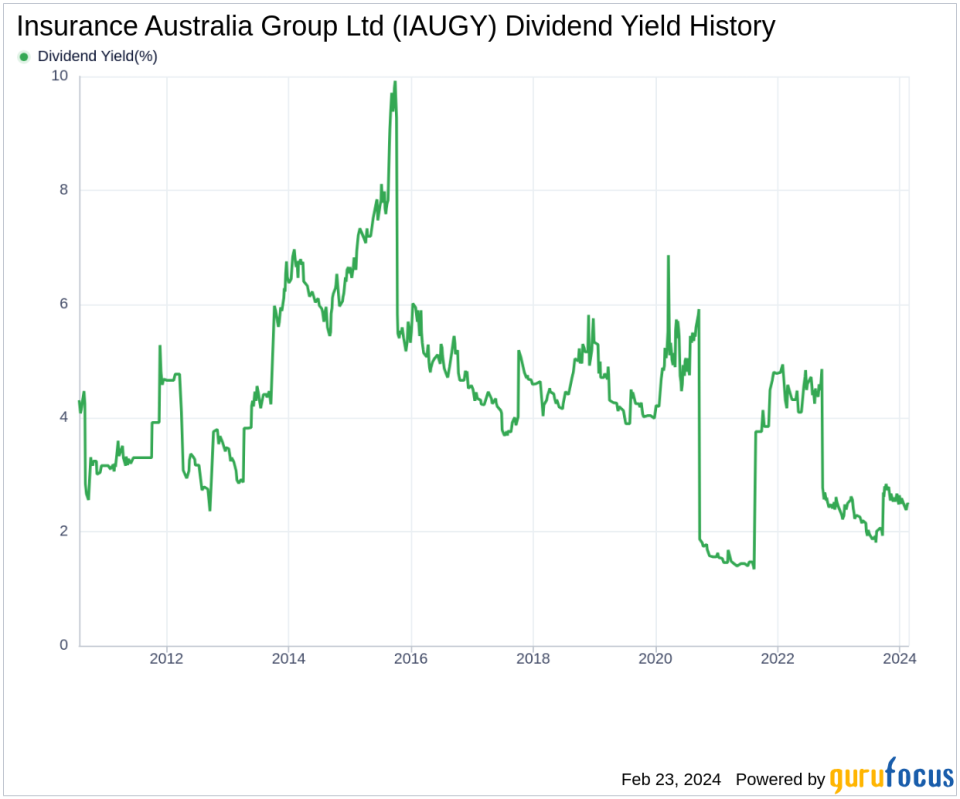
A Glimpse at Insurance Australia Group Ltd's Dividend History
Insurance Australia Group Ltd has maintained a consistent dividend payment record since 2009. Dividends are currently distributed on a bi-annual basis. Below is a chart showing annual Dividends Per Share for tracking historical trends.
Breaking Down Insurance Australia Group Ltd's Dividend Yield and Growth
As of today, Insurance Australia Group Ltd currently has a 12-month trailing dividend yield of 2.49% and a 12-month forward dividend yield of 3.12%. This suggests an expectation of increased dividend payments over the next 12 months.
Over the past three years, Insurance Australia Group Ltd's annual dividend growth rate was -28.40%. Extended to a five-year horizon, this rate increased to -22.30% per year. And over the past decade, Insurance Australia Group Ltd's annual dividends per share growth rate stands at -10.10%.
Based on Insurance Australia Group Ltd's dividend yield and five-year growth rate, the 5-year yield on cost of Insurance Australia Group Ltd stock as of today is approximately 0.71%.
The Sustainability Question: Payout Ratio and Profitability
To assess the sustainability of the dividend, one needs to evaluate the company's payout ratio. The dividend payout ratio provides insights into the portion of earnings the company distributes as dividends. A lower ratio suggests that the company retains a significant part of its earnings, thereby ensuring the availability of funds for future growth and unexpected downturns. As of 2023-06-30, Insurance Australia Group Ltd's dividend payout ratio is 0.34.
Insurance Australia Group Ltd's profitability rank, offers an understanding of the company's earnings prowess relative to its peers. GuruFocus ranks Insurance Australia Group Ltd's profitability 5 out of 10 as of 2023-06-30, suggesting fair profitability. The company has reported net profit in 9 years out of the past 10 years.
Growth Metrics: The Future Outlook
To ensure the sustainability of dividends, a company must have robust growth metrics. Insurance Australia Group Ltd's growth rank of 5 out of 10 suggests that the company has a fair growth outlook.
Revenue is the lifeblood of any company, and Insurance Australia Group Ltd's revenue per share, combined with the 3-year revenue growth rate, indicates a strong revenue model. Insurance Australia Group Ltd's revenue has increased by approximately 3.80% per year on average, a rate that underperforms than approximately 55.19% of global competitors.
The company's 3-year EPS growth rate showcases its capability to grow its earnings, a critical component for sustaining dividends in the long run. During the past three years, Insurance Australia Group Ltd's earnings increased by approximately 15.00% per year on average, a rate that underperforms than approximately 30.85% of global competitors.
Lastly, the company's 5-year EBITDA growth rate of -43.60%, which underperforms than approximately 99.32% of global competitors.
Next Steps
In conclusion, while Insurance Australia Group Ltd presents a stable dividend history, the negative growth rates in dividends per share over various time frames raise questions about the long-term growth prospects of these dividends. The company maintains a reasonable payout ratio and has shown profitability, which are positive indicators for sustaining future dividends. However, the underperformance in revenue and earnings growth compared to global competitors suggests that investors should keep a close eye on the company's ability to improve these metrics. With these considerations in mind, value investors should weigh the potential risks and rewards of investing in Insurance Australia Group Ltd for its dividend returns.
GuruFocus Premium users can screen for high-dividend yield stocks using the High Dividend Yield Screener.
This article, generated by GuruFocus, is designed to provide general insights and is not tailored financial advice. Our commentary is rooted in historical data and analyst projections, utilizing an impartial methodology, and is not intended to serve as specific investment guidance. It does not formulate a recommendation to purchase or divest any stock and does not consider individual investment objectives or financial circumstances. Our objective is to deliver long-term, fundamental data-driven analysis. Be aware that our analysis might not incorporate the most recent, price-sensitive company announcements or qualitative information. GuruFocus holds no position in the stocks mentioned herein.
This article first appeared on GuruFocus.