
 Yahoo Finance
 Is Insurance Australia Group Limited (ASX:IAG) A Smart Pick For Income Investors?

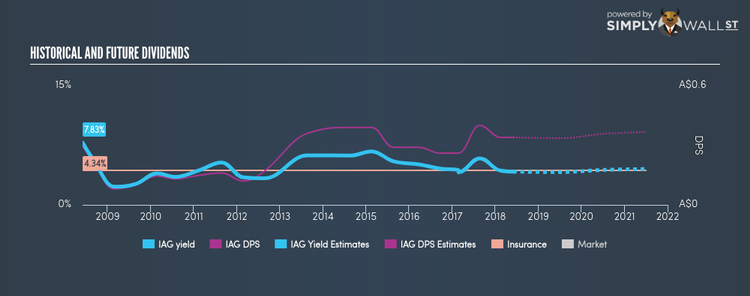
Dividends play a key role in compounding returns over time and can form a large part of our portfolio return. In the past 10 years Insurance Australia Group Limited (ASX:IAG) has returned an average of 5.00% per year to investors in the form of dividend payouts. Let’s dig deeper into whether Insurance Australia Group should have a place in your portfolio. Check out our latest analysis for Insurance Australia Group
5 checks you should do on a dividend stock
When assessing a stock as a potential addition to my dividend Portfolio, I look at these five areas:
Does it pay an annual yield higher than 75% of dividend payers?
Does it consistently pay out dividends without missing a payment of significantly cutting payout?
Has it increased its dividend per share amount over the past?
Does earnings amply cover its dividend payments?
Will it have the ability to keep paying its dividends going forward?
How does Insurance Australia Group fare?
The current trailing twelve-month payout ratio for the stock is 77.70%, which means that the dividend is covered by earnings. Going forward, analysts expect IAG’s payout to remain around the same level at 79.19% of its earnings, which leads to a dividend yield of around 4.20%. Moreover, EPS is forecasted to fall to A$0.41 in the upcoming year. If there is one thing that you want to be reliable in your life, it’s dividend stocks and their constant income stream. Whilst its per-share payments have increased during the past 10 years, there has been some hiccups. Shareholders would have seen a few years of reduced payments in this time. Compared to its peers, Insurance Australia Group generates a yield of 4.18%, which is on the low-side for Insurance stocks.
Next Steps:
With this in mind, I definitely rank Insurance Australia Group as a strong dividend stock, and makes it worth further research for anyone who likes steady income generation from their portfolio. Given that this is purely a dividend analysis, you should always research extensively before deciding whether or not a stock is an appropriate investment for you. I always recommend analysing the company’s fundamentals and underlying business before making an investment decision. I’ve put together three pertinent aspects you should look at:
Future Outlook: What are well-informed industry analysts predicting for IAG’s future growth? Take a look at our free research report of analyst consensus for IAG’s outlook.
Valuation: What is IAG worth today? Even if the stock is a cash cow, it’s not worth an infinite price. The intrinsic value infographic in our free research report helps visualize whether IAG is currently mispriced by the market.
Other Dividend Rockstars: Are there better dividend payers with stronger fundamentals out there? Check out our free list of these great stocks here.
To help readers see pass the short term volatility of the financial market, we aim to bring you a long-term focused research analysis purely driven by fundamental data. Note that our analysis does not factor in the latest price sensitive company announcements.
The author is an independent contributor and at the time of publication had no position in the stocks mentioned.
