
 Yahoo Finance
 Insufficient Growth At Carbonxt Group Limited (ASX:CG1) Hampers Share Price
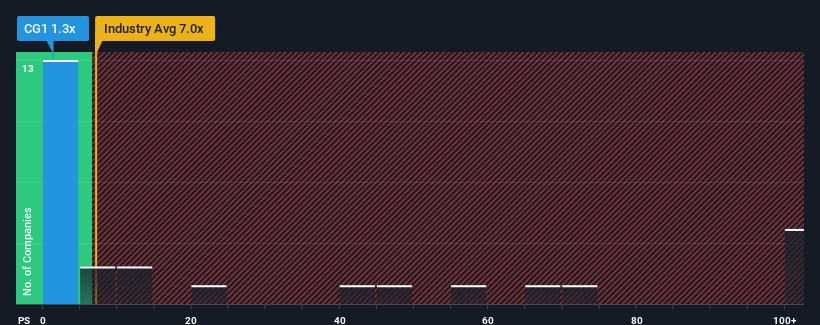
Carbonxt Group Limited's (ASX:CG1) price-to-sales (or "P/S") ratio of 1.3x might make it look like a strong buy right now compared to the Chemicals industry in Australia, where around half of the companies have P/S ratios above 7x and even P/S above 55x are quite common. However, the P/S might be quite low for a reason and it requires further investigation to determine if it's justified.
Check out our latest analysis for Carbonxt Group
What Does Carbonxt Group's Recent Performance Look Like?
The revenue growth achieved at Carbonxt Group over the last year would be more than acceptable for most companies. Perhaps the market is expecting this acceptable revenue performance to take a dive, which has kept the P/S suppressed. If you like the company, you'd be hoping this isn't the case so that you could potentially pick up some stock while it's out of favour.
Although there are no analyst estimates available for Carbonxt Group, take a look at this free data-rich visualisation to see how the company stacks up on earnings, revenue and cash flow.
How Is Carbonxt Group's Revenue Growth Trending?
The only time you'd be truly comfortable seeing a P/S as depressed as Carbonxt Group's is when the company's growth is on track to lag the industry decidedly.
Retrospectively, the last year delivered an exceptional 15% gain to the company's top line. However, this wasn't enough as the latest three year period has seen the company endure a nasty 3.6% drop in revenue in aggregate. So unfortunately, we have to acknowledge that the company has not done a great job of growing revenues over that time.
Weighing that medium-term revenue trajectory against the broader industry's one-year forecast for expansion of 1,285% shows it's an unpleasant look.
With this information, we are not surprised that Carbonxt Group is trading at a P/S lower than the industry. However, we think shrinking revenues are unlikely to lead to a stable P/S over the longer term, which could set up shareholders for future disappointment. Even just maintaining these prices could be difficult to achieve as recent revenue trends are already weighing down the shares.
What We Can Learn From Carbonxt Group's P/S?
Using the price-to-sales ratio alone to determine if you should sell your stock isn't sensible, however it can be a practical guide to the company's future prospects.
As we suspected, our examination of Carbonxt Group revealed its shrinking revenue over the medium-term is contributing to its low P/S, given the industry is set to grow. At this stage investors feel the potential for an improvement in revenue isn't great enough to justify a higher P/S ratio. Given the current circumstances, it seems unlikely that the share price will experience any significant movement in either direction in the near future if recent medium-term revenue trends persist.
You should always think about risks. Case in point, we've spotted 4 warning signs for Carbonxt Group you should be aware of, and 2 of them shouldn't be ignored.
If you're unsure about the strength of Carbonxt Group's business, why not explore our interactive list of stocks with solid business fundamentals for some other companies you may have missed.
Have feedback on this article? Concerned about the content? Get in touch with us directly. Alternatively, email editorial-team (at) simplywallst.com.
This article by Simply Wall St is general in nature. We provide commentary based on historical data and analyst forecasts only using an unbiased methodology and our articles are not intended to be financial advice. It does not constitute a recommendation to buy or sell any stock, and does not take account of your objectives, or your financial situation. We aim to bring you long-term focused analysis driven by fundamental data. Note that our analysis may not factor in the latest price-sensitive company announcements or qualitative material. Simply Wall St has no position in any stocks mentioned.
Join A Paid User Research Session
You’ll receive a US$30 Amazon Gift card for 1 hour of your time while helping us build better investing tools for the individual investors like yourself. Sign up here
