
 Yahoo Finance
 Do Institutions Own Monadelphous Group Limited (ASX:MND) Shares?

If you want to know who really controls Monadelphous Group Limited (ASX:MND), then you'll have to look at the makeup of its share registry. Insiders often own a large chunk of younger, smaller, companies while huge companies tend to have institutions as shareholders. We also tend to see lower insider ownership in companies that were previously publicly owned.
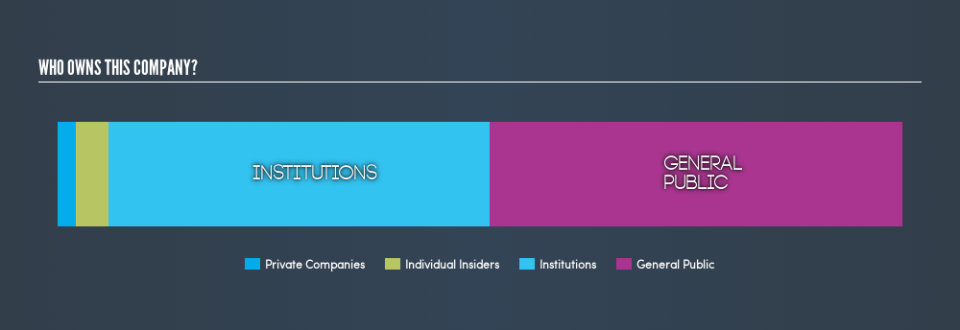
With a market capitalization of AU$1.8b, Monadelphous Group is a decent size, so it is probably on the radar of institutional investors. In the chart below below, we can see that institutions are noticeable on the share registry. Let's delve deeper into each type of owner, to discover more about MND.
View our latest analysis for Monadelphous Group
What Does The Institutional Ownership Tell Us About Monadelphous Group?
Institutions typically measure themselves against a benchmark when reporting to their own investors, so they often become more enthusiastic about a stock once it's included in a major index. We would expect most companies to have some institutions on the register, especially if they are growing.
Monadelphous Group already has institutions on the share registry. Indeed, they own 45% of the company. This suggests some credibility amongst professional investors. But we can't rely on that fact alone, since institutions make bad investments sometimes, just like everyone does. If multiple institutions change their view on a stock at the same time, you could see the share price drop fast. It's therefore worth looking at Monadelphous Group's earnings history, below. Of course, the future is what really matters.

Hedge funds don't have many shares in Monadelphous Group. There are plenty of analysts covering the stock, so it might be worth seeing what they are forecasting, too.
Insider Ownership Of Monadelphous Group
While the precise definition of an insider can be subjective, almost everyone considers board members to be insiders. Management ultimately answers to the board. However, it is not uncommon for managers to be executive board members, especially if they are a founder or the CEO.
Most consider insider ownership a positive because it can indicate the board is well aligned with other shareholders. However, on some occasions too much power is concentrated within this group.
Our most recent data indicates that insiders own some shares in Monadelphous Group Limited. This is a big company, so it is good to see this level of alignment. Insiders own AU$70m worth of shares (at current prices). If you would like to explore the question of insider alignment, you can click here to see if insiders have been buying or selling.
General Public Ownership
With a 49% ownership, the general public have some degree of sway over MND. While this size of ownership may not be enough to sway a policy decision in their favour, they can still make a collective impact on company policies.
Next Steps:
I find it very interesting to look at who exactly owns a company. But to truly gain insight, we need to consider other information, too.
I always like to check for a history of revenue growth. You can too, by accessing this free chart of historic revenue and earnings in this detailed graph.
But ultimately it is the future, not the past, that will determine how well the owners of this business will do. Therefore we think it advisable to take a look at this free report showing whether analysts are predicting a brighter future.
NB: Figures in this article are calculated using data from the last twelve months, which refer to the 12-month period ending on the last date of the month the financial statement is dated. This may not be consistent with full year annual report figures.
We aim to bring you long-term focused research analysis driven by fundamental data. Note that our analysis may not factor in the latest price-sensitive company announcements or qualitative material.
If you spot an error that warrants correction, please contact the editor at editorial-team@simplywallst.com. This article by Simply Wall St is general in nature. It does not constitute a recommendation to buy or sell any stock, and does not take account of your objectives, or your financial situation. Simply Wall St has no position in the stocks mentioned. Thank you for reading.
