
 Yahoo Finance
 Inspire Medical Systems, Inc.'s (NYSE:INSP) P/S Is On The Mark
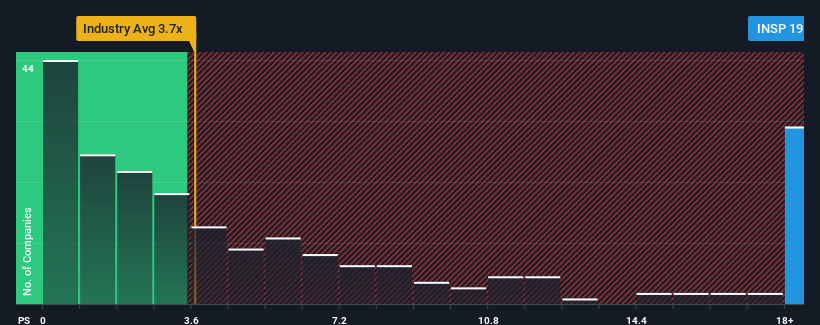
Inspire Medical Systems, Inc.'s (NYSE:INSP) price-to-sales (or "P/S") ratio of 19x might make it look like a strong sell right now compared to the Medical Equipment industry in the United States, where around half of the companies have P/S ratios below 3.7x and even P/S below 1.5x are quite common. Nonetheless, we'd need to dig a little deeper to determine if there is a rational basis for the highly elevated P/S.
Check out our latest analysis for Inspire Medical Systems
What Does Inspire Medical Systems' P/S Mean For Shareholders?
With revenue growth that's superior to most other companies of late, Inspire Medical Systems has been doing relatively well. It seems that many are expecting the strong revenue performance to persist, which has raised the P/S. If not, then existing shareholders might be a little nervous about the viability of the share price.
Want the full picture on analyst estimates for the company? Then our free report on Inspire Medical Systems will help you uncover what's on the horizon.
Do Revenue Forecasts Match The High P/S Ratio?
There's an inherent assumption that a company should far outperform the industry for P/S ratios like Inspire Medical Systems' to be considered reasonable.
Retrospectively, the last year delivered an exceptional 75% gain to the company's top line. This great performance means it was also able to deliver immense revenue growth over the last three years. Therefore, it's fair to say the revenue growth recently has been superb for the company.
Turning to the outlook, the next three years should generate growth of 29% per year as estimated by the twelve analysts watching the company. With the industry only predicted to deliver 8.9% each year, the company is positioned for a stronger revenue result.
With this in mind, it's not hard to understand why Inspire Medical Systems' P/S is high relative to its industry peers. Apparently shareholders aren't keen to offload something that is potentially eyeing a more prosperous future.
The Key Takeaway
Using the price-to-sales ratio alone to determine if you should sell your stock isn't sensible, however it can be a practical guide to the company's future prospects.
Our look into Inspire Medical Systems shows that its P/S ratio remains high on the merit of its strong future revenues. It appears that shareholders are confident in the company's future revenues, which is propping up the P/S. Unless the analysts have really missed the mark, these strong revenue forecasts should keep the share price buoyant.
Plus, you should also learn about this 1 warning sign we've spotted with Inspire Medical Systems.
If strong companies turning a profit tickle your fancy, then you'll want to check out this free list of interesting companies that trade on a low P/E (but have proven they can grow earnings).
Have feedback on this article? Concerned about the content? Get in touch with us directly. Alternatively, email editorial-team (at) simplywallst.com.
This article by Simply Wall St is general in nature. We provide commentary based on historical data and analyst forecasts only using an unbiased methodology and our articles are not intended to be financial advice. It does not constitute a recommendation to buy or sell any stock, and does not take account of your objectives, or your financial situation. We aim to bring you long-term focused analysis driven by fundamental data. Note that our analysis may not factor in the latest price-sensitive company announcements or qualitative material. Simply Wall St has no position in any stocks mentioned.
Join A Paid User Research Session
You’ll receive a US$30 Amazon Gift card for 1 hour of your time while helping us build better investing tools for the individual investors like yourself. Sign up here
