
 Yahoo Finance
 Industrial Production Figures Beat After Weak Housing Data
Talking Points:
-Industrial Production (MAR) comes in at 0.7% vs. 0.5% estimated
-February figures for Industrial Production revised higher from 0.6% to 1.2%
-Capacity Utilization (MAR) comes in at 0.5% vs. 0.6% estimated
-US Housing Starts, Building Permits disappoint market expectations
-Bank of Canada at 14:00GMT
Industrial Production figures for March came in slightly above market expectations while February figures saw a healthy revision from 0.6% to 1.2%. This print instills some confidence after a quarter of weak data out of the United States, blamed by analysts across the board on poor weather in the Northeast and Midwest. Although the upward revision shows a healthy sign in production, the MoM beat still remained below 1.0%.
Earlier we saw US Housing Starts and Building Permits for the month of March miss market estimates and contributed to USD weakness against the Yen. The month over month rise was expected to come in at 7.0% for housing starts, but came in at 2.8% while building permits declined 2.4% vs. -0.4% estimates.
Industrial Production is a measure of raw volume and includes, but is not limited to, the volume production from utilities, factories, mines, etc… The Capacity Utilization figure is a measure used to evaluate the current levels of output that are currently in use. The percentage difference between 100% and the figure would indicate the extra capacity in the economy.
EURUSD April 16th, 2014 (5-Minute Chart)
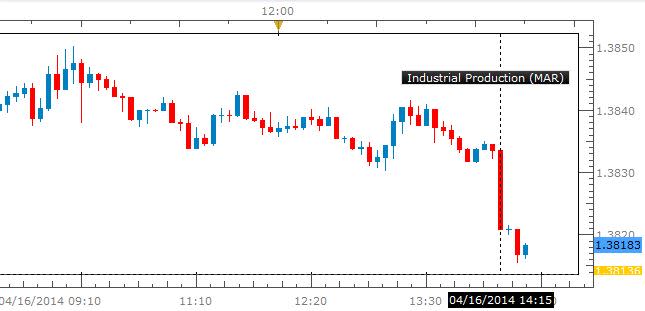
Source: FXCM Marketscope
The USDollar saw strength following the print against the majors, including an intraday high in USDJPY. This morning in New York we are seeing some disconcerting developments out of Ukraine and this may continue to weigh on market sentiment as equity markets come online. Note that we have the Bank of Canada Rate Decision at 14:00GMT.
Gregory Marks, DailyFX Research Team
Keep up to date on event risk with the DailyFX Calendar.
How does a Currency War affect your FX trading?
DailyFX provides forex news and technical analysis on the trends that influence the global currency markets.
Learn forex trading with a free practice account and trading charts from FXCM.
