
 Yahoo Finance
 Indivior (LON:INDV) shareholders have earned a 80% CAGR over the last three years
Generally speaking, investors are inspired to be stock pickers by the potential to find the big winners. Mistakes are inevitable, but a single top stock pick can cover any losses, and so much more. One bright shining star stock has been Indivior PLC (LON:INDV), which is 483% higher than three years ago. In the last week the share price is up 1.6%.
So let's investigate and see if the longer term performance of the company has been in line with the underlying business' progress.
View our latest analysis for Indivior
While markets are a powerful pricing mechanism, share prices reflect investor sentiment, not just underlying business performance. One imperfect but simple way to consider how the market perception of a company has shifted is to compare the change in the earnings per share (EPS) with the share price movement.
Over the last three years, Indivior failed to grow earnings per share, which fell 11% (annualized).
So we doubt that the market is looking to EPS for its main judge of the company's value. Since the change in EPS doesn't seem to correlate with the change in share price, it's worth taking a look at other metrics.
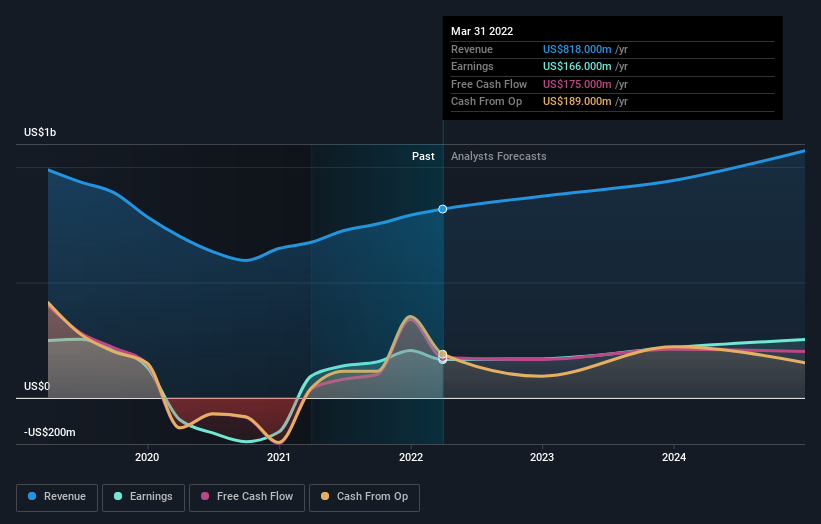
You can only imagine how long term shareholders feel about the declining revenue trend (slipping at 7.2% per year). The only thing that's clear is there is low correlation between Indivior's share price and its historic fundamental data. Further research may be required!
The company's revenue and earnings (over time) are depicted in the image below (click to see the exact numbers).
We like that insiders have been buying shares in the last twelve months. Even so, future earnings will be far more important to whether current shareholders make money. So it makes a lot of sense to check out what analysts think Indivior will earn in the future (free profit forecasts).
A Different Perspective
We're pleased to report that Indivior shareholders have received a total shareholder return of 107% over one year. That certainly beats the loss of about 3% per year over the last half decade. We generally put more weight on the long term performance over the short term, but the recent improvement could hint at a (positive) inflection point within the business. It is all well and good that insiders have been buying shares, but we suggest you check here to see what price insiders were buying at.
There are plenty of other companies that have insiders buying up shares. You probably do not want to miss this free list of growing companies that insiders are buying.
Please note, the market returns quoted in this article reflect the market weighted average returns of stocks that currently trade on GB exchanges.
Have feedback on this article? Concerned about the content? Get in touch with us directly. Alternatively, email editorial-team (at) simplywallst.com.
This article by Simply Wall St is general in nature. We provide commentary based on historical data and analyst forecasts only using an unbiased methodology and our articles are not intended to be financial advice. It does not constitute a recommendation to buy or sell any stock, and does not take account of your objectives, or your financial situation. We aim to bring you long-term focused analysis driven by fundamental data. Note that our analysis may not factor in the latest price-sensitive company announcements or qualitative material. Simply Wall St has no position in any stocks mentioned.
Join A Paid User Research Session
You’ll receive a US$30 Amazon Gift card for 1 hour of your time while helping us build better investing tools for the individual investors like yourself. Sign up here
