
 Yahoo Finance
 Individual investors account for 56% of EBOS Group Limited's (NZSE:EBO) ownership, while institutions account for 25%
Key Insights
Significant control over EBOS Group by individual investors implies that the general public has more power to influence management and governance-related decisions
The top 25 shareholders own 43% of the company
A look at the shareholders of EBOS Group Limited (NZSE:EBO) can tell us which group is most powerful. We can see that individual investors own the lion's share in the company with 56% ownership. In other words, the group stands to gain the most (or lose the most) from their investment into the company.
Institutions, on the other hand, account for 25% of the company's stockholders. Large companies usually have institutions as shareholders, and we usually see insiders owning shares in smaller companies.
In the chart below, we zoom in on the different ownership groups of EBOS Group.
Check out our latest analysis for EBOS Group

What Does The Institutional Ownership Tell Us About EBOS Group?
Institutions typically measure themselves against a benchmark when reporting to their own investors, so they often become more enthusiastic about a stock once it's included in a major index. We would expect most companies to have some institutions on the register, especially if they are growing.
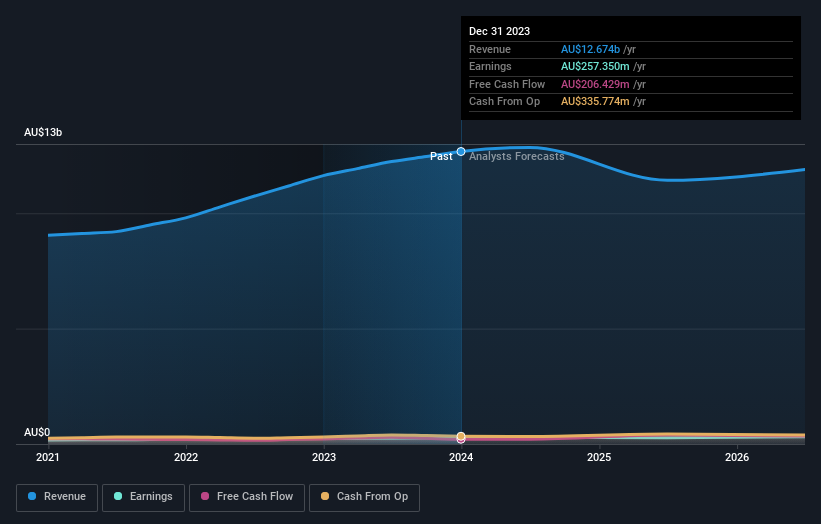
As you can see, institutional investors have a fair amount of stake in EBOS Group. This can indicate that the company has a certain degree of credibility in the investment community. However, it is best to be wary of relying on the supposed validation that comes with institutional investors. They too, get it wrong sometimes. If multiple institutions change their view on a stock at the same time, you could see the share price drop fast. It's therefore worth looking at EBOS Group's earnings history below. Of course, the future is what really matters.
Hedge funds don't have many shares in EBOS Group. Our data shows that Sybos Holdings Pte Limited is the largest shareholder with 19% of shares outstanding. BlackRock, Inc. is the second largest shareholder owning 5.0% of common stock, and Capital Research and Management Company holds about 3.8% of the company stock.
A deeper look at our ownership data shows that the top 25 shareholders collectively hold less than half of the register, suggesting a large group of small holders where no single shareholder has a majority.
Researching institutional ownership is a good way to gauge and filter a stock's expected performance. The same can be achieved by studying analyst sentiments. There are a reasonable number of analysts covering the stock, so it might be useful to find out their aggregate view on the future.
Insider Ownership Of EBOS Group
The definition of company insiders can be subjective and does vary between jurisdictions. Our data reflects individual insiders, capturing board members at the very least. Company management run the business, but the CEO will answer to the board, even if he or she is a member of it.
Insider ownership is positive when it signals leadership are thinking like the true owners of the company. However, high insider ownership can also give immense power to a small group within the company. This can be negative in some circumstances.
Our information suggests that EBOS Group Limited insiders own under 1% of the company. But they may have an indirect interest through a corporate structure that we haven't picked up on. It is a pretty big company, so it would be possible for board members to own a meaningful interest in the company, without owning much of a proportional interest. In this case, they own around NZ$7.4m worth of shares (at current prices). It is good to see board members owning shares, but it might be worth checking if those insiders have been buying.
General Public Ownership
The general public, who are usually individual investors, hold a substantial 56% stake in EBOS Group, suggesting it is a fairly popular stock. This size of ownership gives investors from the general public some collective power. They can and probably do influence decisions on executive compensation, dividend policies and proposed business acquisitions.
Private Company Ownership
We can see that Private Companies own 20%, of the shares on issue. It might be worth looking deeper into this. If related parties, such as insiders, have an interest in one of these private companies, that should be disclosed in the annual report. Private companies may also have a strategic interest in the company.
Next Steps:
While it is well worth considering the different groups that own a company, there are other factors that are even more important. To that end, you should be aware of the 3 warning signs we've spotted with EBOS Group .
Ultimately the future is most important. You can access this free report on analyst forecasts for the company.
NB: Figures in this article are calculated using data from the last twelve months, which refer to the 12-month period ending on the last date of the month the financial statement is dated. This may not be consistent with full year annual report figures.
Have feedback on this article? Concerned about the content? Get in touch with us directly. Alternatively, email editorial-team (at) simplywallst.com.
This article by Simply Wall St is general in nature. We provide commentary based on historical data and analyst forecasts only using an unbiased methodology and our articles are not intended to be financial advice. It does not constitute a recommendation to buy or sell any stock, and does not take account of your objectives, or your financial situation. We aim to bring you long-term focused analysis driven by fundamental data. Note that our analysis may not factor in the latest price-sensitive company announcements or qualitative material. Simply Wall St has no position in any stocks mentioned.
