
 Yahoo Finance
 Incitec Pivot (ASX:IPL) shareholders have endured a 10% loss from investing in the stock a year ago
It's easy to match the overall market return by buying an index fund. But if you buy individual stocks, you can do both better or worse than that. Investors in Incitec Pivot Limited (ASX:IPL) have tasted that bitter downside in the last year, as the share price dropped 22%. That falls noticeably short of the market return of around 7.1%. The silver lining (for longer term investors) is that the stock is still 1.9% higher than it was three years ago. Shareholders have had an even rougher run lately, with the share price down 11% in the last 90 days.
So let's have a look and see if the longer term performance of the company has been in line with the underlying business' progress.
Check out our latest analysis for Incitec Pivot
While markets are a powerful pricing mechanism, share prices reflect investor sentiment, not just underlying business performance. One flawed but reasonable way to assess how sentiment around a company has changed is to compare the earnings per share (EPS) with the share price.
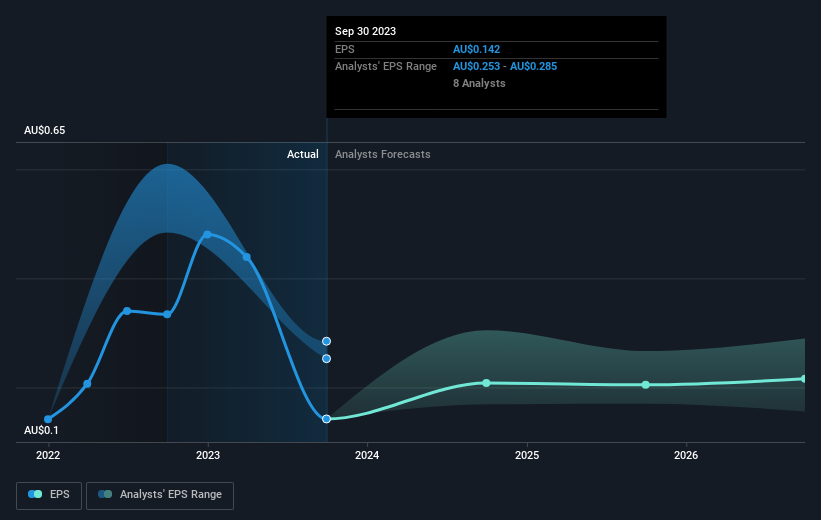
Unfortunately Incitec Pivot reported an EPS drop of 57% for the last year. This fall in the EPS is significantly worse than the 22% the share price fall. It may have been that the weak EPS was not as bad as some had feared.
The graphic below depicts how EPS has changed over time (unveil the exact values by clicking on the image).
Before buying or selling a stock, we always recommend a close examination of historic growth trends, available here.
What About Dividends?
As well as measuring the share price return, investors should also consider the total shareholder return (TSR). The TSR incorporates the value of any spin-offs or discounted capital raisings, along with any dividends, based on the assumption that the dividends are reinvested. Arguably, the TSR gives a more comprehensive picture of the return generated by a stock. We note that for Incitec Pivot the TSR over the last 1 year was -10%, which is better than the share price return mentioned above. This is largely a result of its dividend payments!
A Different Perspective
Investors in Incitec Pivot had a tough year, with a total loss of 10% (including dividends), against a market gain of about 7.1%. Even the share prices of good stocks drop sometimes, but we want to see improvements in the fundamental metrics of a business, before getting too interested. On the bright side, long term shareholders have made money, with a gain of 1.2% per year over half a decade. If the fundamental data continues to indicate long term sustainable growth, the current sell-off could be an opportunity worth considering. It's always interesting to track share price performance over the longer term. But to understand Incitec Pivot better, we need to consider many other factors. For instance, we've identified 2 warning signs for Incitec Pivot (1 is significant) that you should be aware of.
If you would prefer to check out another company -- one with potentially superior financials -- then do not miss this free list of companies that have proven they can grow earnings.
Please note, the market returns quoted in this article reflect the market weighted average returns of stocks that currently trade on Australian exchanges.
Have feedback on this article? Concerned about the content? Get in touch with us directly. Alternatively, email editorial-team (at) simplywallst.com.
This article by Simply Wall St is general in nature. We provide commentary based on historical data and analyst forecasts only using an unbiased methodology and our articles are not intended to be financial advice. It does not constitute a recommendation to buy or sell any stock, and does not take account of your objectives, or your financial situation. We aim to bring you long-term focused analysis driven by fundamental data. Note that our analysis may not factor in the latest price-sensitive company announcements or qualitative material. Simply Wall St has no position in any stocks mentioned.
