
 Yahoo Finance
 Can You Imagine How Elated Ava Risk Group's (ASX:AVA) Shareholders Feel About Its 375% Share Price Gain?
Ava Risk Group Limited (ASX:AVA) shareholders have seen the share price descend 23% over the month. But over the last three years the stock has shone bright like a diamond. The longer term view reveals that the share price is up 375% in that period. So you might argue that the recent reduction in the share price is unremarkable in light of the longer term performance. The thing to consider is whether there is still too much elation around the company's prospects.
View our latest analysis for Ava Risk Group
While the efficient markets hypothesis continues to be taught by some, it has been proven that markets are over-reactive dynamic systems, and investors are not always rational. By comparing earnings per share (EPS) and share price changes over time, we can get a feel for how investor attitudes to a company have morphed over time.
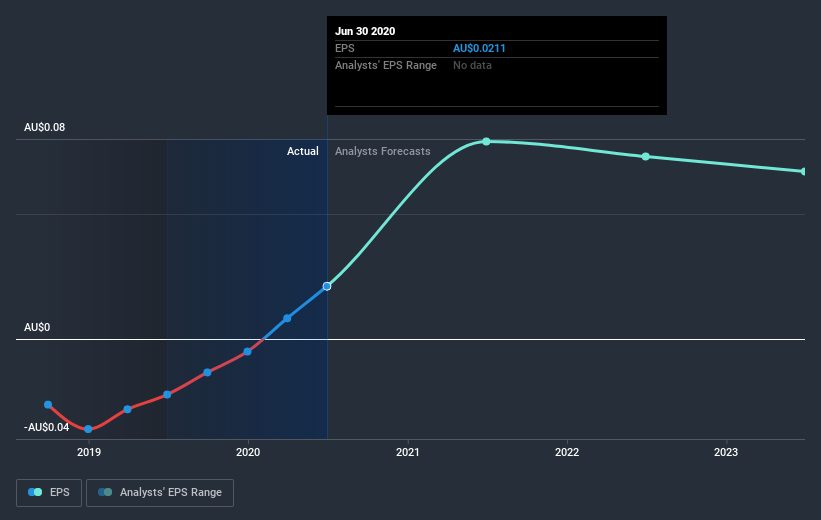
During three years of share price growth, Ava Risk Group moved from a loss to profitability. Given the importance of this milestone, it's not overly surprising that the share price has increased strongly.
You can see how EPS has changed over time in the image below (click on the chart to see the exact values).
We like that insiders have been buying shares in the last twelve months. Even so, future earnings will be far more important to whether current shareholders make money. It might be well worthwhile taking a look at our free report on Ava Risk Group's earnings, revenue and cash flow.
What about the Total Shareholder Return (TSR)?
We've already covered Ava Risk Group's share price action, but we should also mention its total shareholder return (TSR). The TSR is a return calculation that accounts for the value of cash dividends (assuming that any dividend received was reinvested) and the calculated value of any discounted capital raisings and spin-offs. Ava Risk Group hasn't been paying dividends, but its TSR of 389% exceeds its share price return of 375%, implying it has either spun-off a business, or raised capital at a discount; thereby providing additional value to shareholders.
A Different Perspective
It's nice to see that Ava Risk Group shareholders have received a total shareholder return of 279% over the last year. Notably the five-year annualised TSR loss of 8% per year compares very unfavourably with the recent share price performance. We generally put more weight on the long term performance over the short term, but the recent improvement could hint at a (positive) inflection point within the business. I find it very interesting to look at share price over the long term as a proxy for business performance. But to truly gain insight, we need to consider other information, too. For example, we've discovered 2 warning signs for Ava Risk Group that you should be aware of before investing here.
There are plenty of other companies that have insiders buying up shares. You probably do not want to miss this free list of growing companies that insiders are buying.
Please note, the market returns quoted in this article reflect the market weighted average returns of stocks that currently trade on AU exchanges.
This article by Simply Wall St is general in nature. It does not constitute a recommendation to buy or sell any stock, and does not take account of your objectives, or your financial situation. We aim to bring you long-term focused analysis driven by fundamental data. Note that our analysis may not factor in the latest price-sensitive company announcements or qualitative material. Simply Wall St has no position in any stocks mentioned.
Have feedback on this article? Concerned about the content? Get in touch with us directly. Alternatively, email editorial-team (at) simplywallst.com.
