
 Yahoo Finance
 Can You Imagine How Clearway Energy's (NYSE:CWEN.A) Shareholders Feel About The 23% Share Price Increase?

Buying a low-cost index fund will get you the average market return. But in any diversified portfolio of stocks, you'll see some that fall short of the average. For example, the Clearway Energy, Inc. (NYSE:CWEN.A) share price return of 23% over three years lags the market return in the same period. Looking at more recent returns, the stock is up 14% in a year.
Check out our latest analysis for Clearway Energy
While the efficient markets hypothesis continues to be taught by some, it has been proven that markets are over-reactive dynamic systems, and investors are not always rational. One imperfect but simple way to consider how the market perception of a company has shifted is to compare the change in the earnings per share (EPS) with the share price movement.
Over the last three years, Clearway Energy failed to grow earnings per share, which fell 80% (annualized).
This means it's unlikely the market is judging the company based on earnings growth. Given this situation, it makes sense to look at other metrics too.
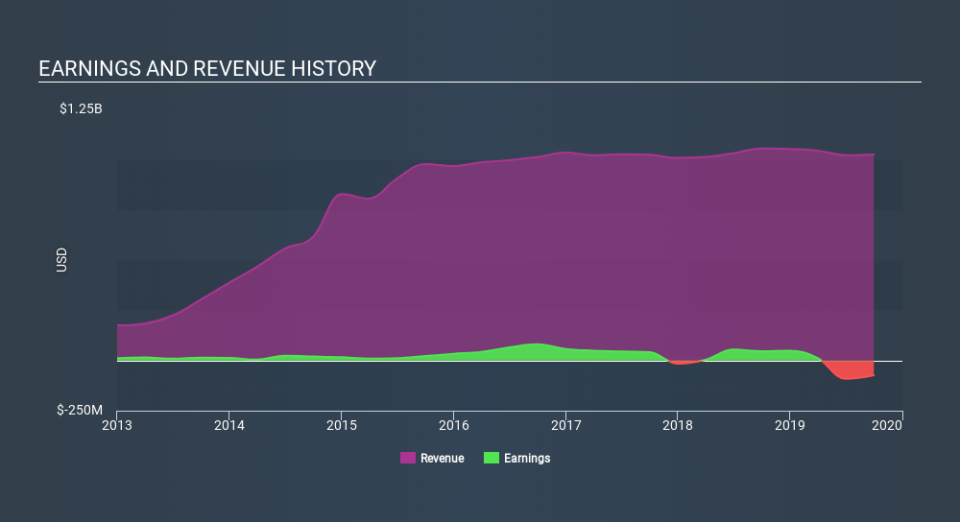
The dividend is no better now than it was three years ago, so that is unlikely to have driven the share price higher. And revenue growth isn't impressive. It may be that a closer look at revenue trends can explain the share price.
The image below shows how earnings and revenue have tracked over time (if you click on the image you can see greater detail).
We like that insiders have been buying shares in the last twelve months. Even so, future earnings will be far more important to whether current shareholders make money. If you are thinking of buying or selling Clearway Energy stock, you should check out this free report showing analyst profit forecasts.
What About Dividends?
When looking at investment returns, it is important to consider the difference between total shareholder return (TSR) and share price return. The TSR is a return calculation that accounts for the value of cash dividends (assuming that any dividend received was reinvested) and the calculated value of any discounted capital raisings and spin-offs. Arguably, the TSR gives a more comprehensive picture of the return generated by a stock. We note that for Clearway Energy the TSR over the last 3 years was 47%, which is better than the share price return mentioned above. This is largely a result of its dividend payments!
A Different Perspective
Clearway Energy provided a TSR of 20% over the last twelve months. Unfortunately this falls short of the market return. On the bright side, that's still a gain, and it's actually better than the average return of 1.7% over half a decade This could indicate that the company is winning over new investors, as it pursues its strategy. Investors who like to make money usually check up on insider purchases, such as the price paid, and total amount bought. You can find out about the insider purchases of Clearway Energy by clicking this link.
If you like to buy stocks alongside management, then you might just love this free list of companies. (Hint: insiders have been buying them).
Please note, the market returns quoted in this article reflect the market weighted average returns of stocks that currently trade on US exchanges.
If you spot an error that warrants correction, please contact the editor at editorial-team@simplywallst.com. This article by Simply Wall St is general in nature. It does not constitute a recommendation to buy or sell any stock, and does not take account of your objectives, or your financial situation. Simply Wall St has no position in the stocks mentioned.
We aim to bring you long-term focused research analysis driven by fundamental data. Note that our analysis may not factor in the latest price-sensitive company announcements or qualitative material. Thank you for reading.
