
 Yahoo Finance
 Can You Imagine How Baby Bunting Group's (ASX:BBN) Shareholders Feel About The 44% Share Price Increase?

It might be of some concern to shareholders to see the Baby Bunting Group Limited (ASX:BBN) share price down 15% in the last month. But over the last three years returns have been decent. In fact the stock is up 44%, which is better than the market return of 42%.
View our latest analysis for Baby Bunting Group
To paraphrase Benjamin Graham: Over the short term the market is a voting machine, but over the long term it's a weighing machine. One flawed but reasonable way to assess how sentiment around a company has changed is to compare the earnings per share (EPS) with the share price.
During three years of share price growth, Baby Bunting Group achieved compound earnings per share growth of 12% per year. We don't think it is entirely coincidental that the EPS growth is reasonably close to the 13% average annual increase in the share price. This observation indicates that the market's attitude to the business hasn't changed all that much. Rather, the share price has approximately tracked EPS growth.
You can see below how EPS has changed over time (discover the exact values by clicking on the image).
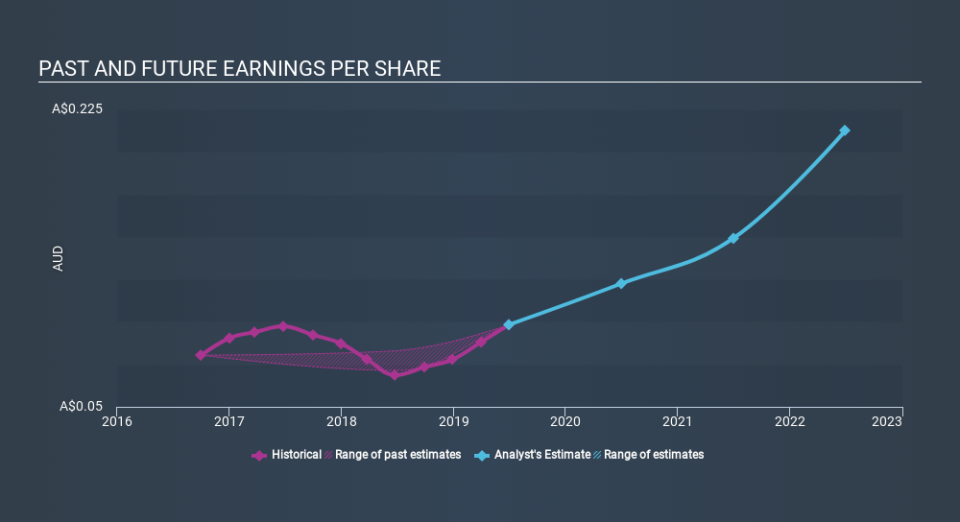
We like that insiders have been buying shares in the last twelve months. Even so, future earnings will be far more important to whether current shareholders make money. Dive deeper into the earnings by checking this interactive graph of Baby Bunting Group's earnings, revenue and cash flow.
What About Dividends?
When looking at investment returns, it is important to consider the difference between total shareholder return (TSR) and share price return. Whereas the share price return only reflects the change in the share price, the TSR includes the value of dividends (assuming they were reinvested) and the benefit of any discounted capital raising or spin-off. Arguably, the TSR gives a more comprehensive picture of the return generated by a stock. We note that for Baby Bunting Group the TSR over the last 3 years was 59%, which is better than the share price return mentioned above. And there's no prize for guessing that the dividend payments largely explain the divergence!
A Different Perspective
We're pleased to report that Baby Bunting Group rewarded shareholders with a total shareholder return of 45% over the last year. And yes, that does include the dividend. That gain actually surpasses the 17% TSR it generated (per year) over three years. These improved returns may hint at some real business momentum, implying that now could be a great time to delve deeper. Investors who like to make money usually check up on insider purchases, such as the price paid, and total amount bought. You can find out about the insider purchases of Baby Bunting Group by clicking this link.
Baby Bunting Group is not the only stock that insiders are buying. For those who like to find winning investments this free list of growing companies with recent insider purchasing, could be just the ticket.
Please note, the market returns quoted in this article reflect the market weighted average returns of stocks that currently trade on AU exchanges.
If you spot an error that warrants correction, please contact the editor at editorial-team@simplywallst.com. This article by Simply Wall St is general in nature. It does not constitute a recommendation to buy or sell any stock, and does not take account of your objectives, or your financial situation. Simply Wall St has no position in the stocks mentioned.
We aim to bring you long-term focused research analysis driven by fundamental data. Note that our analysis may not factor in the latest price-sensitive company announcements or qualitative material. Thank you for reading.
