
 Yahoo Finance
 Iluka Resources (ASX:ILU) sheds AU$94m, company earnings and investor returns have been trending downwards for past year
Passive investing in an index fund is a good way to ensure your own returns roughly match the overall market. But if you buy individual stocks, you can do both better or worse than that. For example, the Iluka Resources Limited (ASX:ILU) share price is down 36% in the last year. That's well below the market decline of 1.1%. The silver lining (for longer term investors) is that the stock is still 17% higher than it was three years ago. The falls have accelerated recently, with the share price down 19% in the last three months.
If the past week is anything to go by, investor sentiment for Iluka Resources isn't positive, so let's see if there's a mismatch between fundamentals and the share price.
Check out our latest analysis for Iluka Resources
While the efficient markets hypothesis continues to be taught by some, it has been proven that markets are over-reactive dynamic systems, and investors are not always rational. By comparing earnings per share (EPS) and share price changes over time, we can get a feel for how investor attitudes to a company have morphed over time.
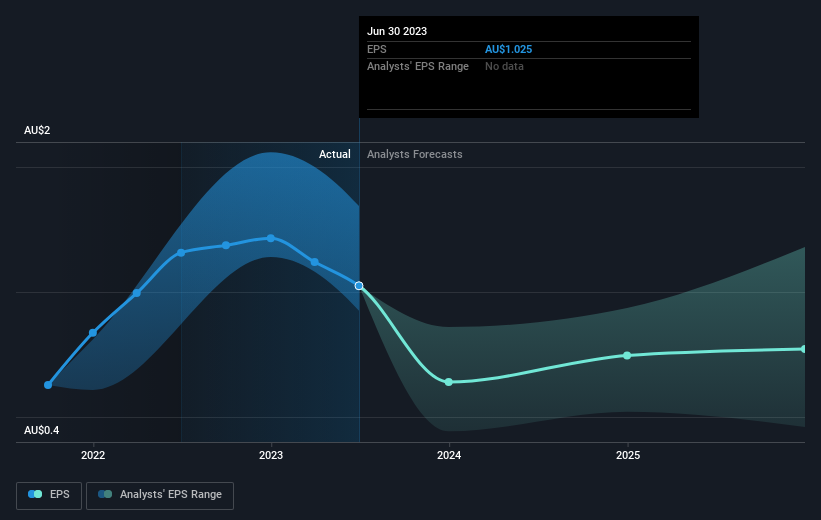
Unhappily, Iluka Resources had to report a 11% decline in EPS over the last year. This reduction in EPS is not as bad as the 36% share price fall. So it seems the market was too confident about the business, a year ago. The P/E ratio of 6.58 also points to the negative market sentiment.
The company's earnings per share (over time) is depicted in the image below (click to see the exact numbers).
It is of course excellent to see how Iluka Resources has grown profits over the years, but the future is more important for shareholders. Take a more thorough look at Iluka Resources' financial health with this free report on its balance sheet.
A Different Perspective
While the broader market gained around 1.1% in the last year, Iluka Resources shareholders lost 35% (even including dividends). However, keep in mind that even the best stocks will sometimes underperform the market over a twelve month period. Longer term investors wouldn't be so upset, since they would have made 15%, each year, over five years. It could be that the recent sell-off is an opportunity, so it may be worth checking the fundamental data for signs of a long term growth trend. While it is well worth considering the different impacts that market conditions can have on the share price, there are other factors that are even more important. Even so, be aware that Iluka Resources is showing 2 warning signs in our investment analysis , and 1 of those is potentially serious...
Of course, you might find a fantastic investment by looking elsewhere. So take a peek at this free list of companies we expect will grow earnings.
Please note, the market returns quoted in this article reflect the market weighted average returns of stocks that currently trade on Australian exchanges.
Have feedback on this article? Concerned about the content? Get in touch with us directly. Alternatively, email editorial-team (at) simplywallst.com.
This article by Simply Wall St is general in nature. We provide commentary based on historical data and analyst forecasts only using an unbiased methodology and our articles are not intended to be financial advice. It does not constitute a recommendation to buy or sell any stock, and does not take account of your objectives, or your financial situation. We aim to bring you long-term focused analysis driven by fundamental data. Note that our analysis may not factor in the latest price-sensitive company announcements or qualitative material. Simply Wall St has no position in any stocks mentioned.