
 Yahoo Finance
 Are IDP Education Limited’s (ASX:IEL) Interest Costs Too High?

While small-cap stocks, such as IDP Education Limited (ASX:IEL) with its market cap of AU$2.63b, are popular for their explosive growth, investors should also be aware of their balance sheet to judge whether the company can survive a downturn. Evaluating financial health as part of your investment thesis is vital, since poor capital management may bring about bankruptcies, which occur at a higher rate for small-caps. I believe these basic checks tell most of the story you need to know. However, since I only look at basic financial figures, I suggest you dig deeper yourself into IEL here.
Does IEL produce enough cash relative to debt?
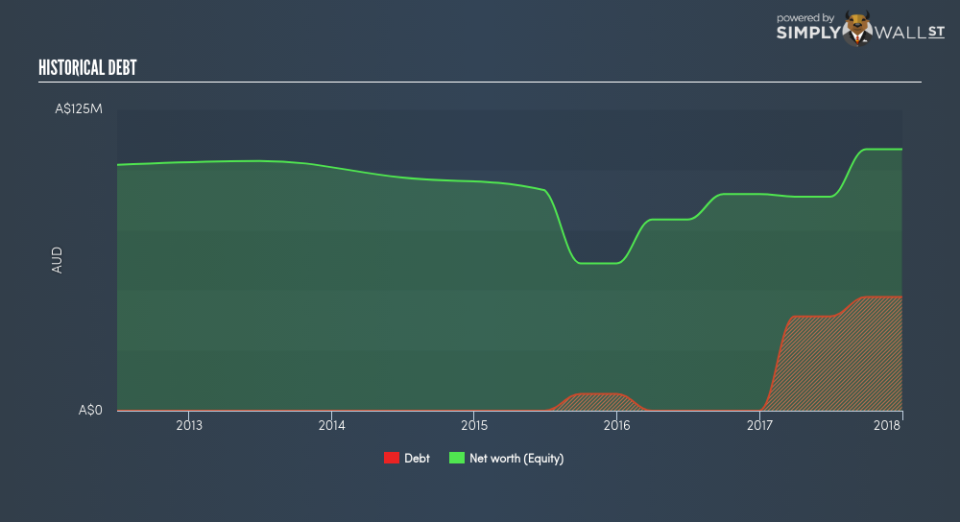
Over the past year, IEL has borrowed debt capital of around AU$39.11m comprising of short- and long-term debt. With this growth in debt, the current cash and short-term investment levels stands at AU$41.96m , ready to deploy into the business. Additionally, IEL has produced cash from operations of AU$58.81m over the same time period, resulting in an operating cash to total debt ratio of 150.38%, signalling that IEL’s current level of operating cash is high enough to cover debt. This ratio can also be interpreted as a measure of efficiency as an alternative to return on assets. In IEL’s case, it is able to generate 1.5x cash from its debt capital.
Can IEL meet its short-term obligations with the cash in hand?
At the current liabilities level of AU$101.60m liabilities, it seems that the business is not able to meet these obligations given the level of current assets of AU$94.58m, with a current ratio of 0.93x below the prudent level of 3x.
Can IEL service its debt comfortably?
IEL is a relatively highly levered company with a debt-to-equity of 43.45%. This is not uncommon for a small-cap company given that debt tends to be lower-cost and at times, more accessible. We can check to see whether IEL is able to meet its debt obligations by looking at the net interest coverage ratio. A company generating earnings before interest and tax (EBIT) at least three times its net interest payments is considered financially sound. In IEL’s, case, the ratio of 54.98x suggests that interest is comfortably covered, which means that debtors may be willing to loan the company more money, giving IEL ample headroom to grow its debt facilities.
Next Steps:
IEL’s high cash coverage means that, although its debt levels are high, the company is able to utilise its borrowings efficiently in order to generate cash flow. But, its low liquidity raises concerns over whether current asset management practices are properly implemented for the small-cap. Keep in mind I haven’t considered other factors such as how IEL has been performing in the past. I suggest you continue to research IDP Education to get a more holistic view of the stock by looking at:
Future Outlook: What are well-informed industry analysts predicting for IEL’s future growth? Take a look at our free research report of analyst consensus for IEL’s outlook.
Valuation: What is IEL worth today? Is the stock undervalued, even when its growth outlook is factored into its intrinsic value? The intrinsic value infographic in our free research report helps visualize whether IEL is currently mispriced by the market.
Other High-Performing Stocks: Are there other stocks that provide better prospects with proven track records? Explore our free list of these great stocks here.
To help readers see pass the short term volatility of the financial market, we aim to bring you a long-term focused research analysis purely driven by fundamental data. Note that our analysis does not factor in the latest price sensitive company announcements.
The author is an independent contributor and at the time of publication had no position in the stocks mentioned.
