
 Yahoo Finance
 Here's What's Concerning About Energy World's (ASX:EWC) Returns On Capital
If we want to find a potential multi-bagger, often there are underlying trends that can provide clues. Ideally, a business will show two trends; firstly a growing return on capital employed (ROCE) and secondly, an increasing amount of capital employed. Basically this means that a company has profitable initiatives that it can continue to reinvest in, which is a trait of a compounding machine. However, after briefly looking over the numbers, we don't think Energy World (ASX:EWC) has the makings of a multi-bagger going forward, but let's have a look at why that may be.
Return On Capital Employed (ROCE): What is it?
For those that aren't sure what ROCE is, it measures the amount of pre-tax profits a company can generate from the capital employed in its business. Analysts use this formula to calculate it for Energy World:
Return on Capital Employed = Earnings Before Interest and Tax (EBIT) ÷ (Total Assets - Current Liabilities)
0.026 = US$41m ÷ (US$1.7b - US$164m) (Based on the trailing twelve months to December 2021).
So, Energy World has an ROCE of 2.6%. Ultimately, that's a low return and it under-performs the Renewable Energy industry average of 6.6%.
View our latest analysis for Energy World
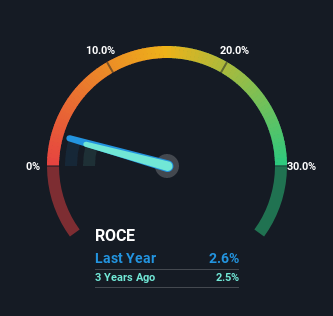
Historical performance is a great place to start when researching a stock so above you can see the gauge for Energy World's ROCE against it's prior returns. If you're interested in investigating Energy World's past further, check out this free graph of past earnings, revenue and cash flow.
How Are Returns Trending?
When we looked at the ROCE trend at Energy World, we didn't gain much confidence. Around five years ago the returns on capital were 5.4%, but since then they've fallen to 2.6%. On the other hand, the company has been employing more capital without a corresponding improvement in sales in the last year, which could suggest these investments are longer term plays. It's worth keeping an eye on the company's earnings from here on to see if these investments do end up contributing to the bottom line.
On a related note, Energy World has decreased its current liabilities to 9.7% of total assets. So we could link some of this to the decrease in ROCE. Effectively this means their suppliers or short-term creditors are funding less of the business, which reduces some elements of risk. Some would claim this reduces the business' efficiency at generating ROCE since it is now funding more of the operations with its own money.
The Key Takeaway
Bringing it all together, while we're somewhat encouraged by Energy World's reinvestment in its own business, we're aware that returns are shrinking. It seems that investors have little hope of these trends getting any better and that may have partly contributed to the stock collapsing 85% in the last five years. Therefore based on the analysis done in this article, we don't think Energy World has the makings of a multi-bagger.
On a separate note, we've found 2 warning signs for Energy World you'll probably want to know about.
While Energy World may not currently earn the highest returns, we've compiled a list of companies that currently earn more than 25% return on equity. Check out this free list here.
Have feedback on this article? Concerned about the content? Get in touch with us directly. Alternatively, email editorial-team (at) simplywallst.com.
This article by Simply Wall St is general in nature. We provide commentary based on historical data and analyst forecasts only using an unbiased methodology and our articles are not intended to be financial advice. It does not constitute a recommendation to buy or sell any stock, and does not take account of your objectives, or your financial situation. We aim to bring you long-term focused analysis driven by fundamental data. Note that our analysis may not factor in the latest price-sensitive company announcements or qualitative material. Simply Wall St has no position in any stocks mentioned.
Join A Paid User Research Session
You’ll receive a US$30 Amazon Gift card for 1 hour of your time while helping us build better investing tools for the individual investors like yourself. Sign up here
