
 Yahoo Finance
 Here's What's Concerning About EBOS Group's (NZSE:EBO) Returns On Capital
There are a few key trends to look for if we want to identify the next multi-bagger. One common approach is to try and find a company with returns on capital employed (ROCE) that are increasing, in conjunction with a growing amount of capital employed. Basically this means that a company has profitable initiatives that it can continue to reinvest in, which is a trait of a compounding machine. However, after investigating EBOS Group (NZSE:EBO), we don't think it's current trends fit the mold of a multi-bagger.
Understanding Return On Capital Employed (ROCE)
For those who don't know, ROCE is a measure of a company's yearly pre-tax profit (its return), relative to the capital employed in the business. The formula for this calculation on EBOS Group is:
Return on Capital Employed = Earnings Before Interest and Tax (EBIT) ÷ (Total Assets - Current Liabilities)
0.11 = AU$465m ÷ (AU$6.9b - AU$2.7b) (Based on the trailing twelve months to December 2023).
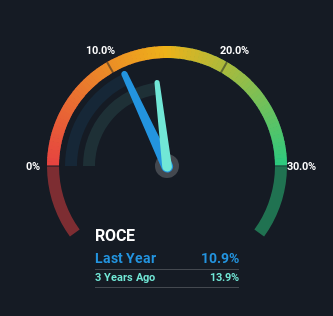
Therefore, EBOS Group has an ROCE of 11%. In absolute terms, that's a satisfactory return, but compared to the Healthcare industry average of 0.1% it's much better.
See our latest analysis for EBOS Group
In the above chart we have measured EBOS Group's prior ROCE against its prior performance, but the future is arguably more important. If you'd like, you can check out the forecasts from the analysts covering EBOS Group for free.
What Does the ROCE Trend For EBOS Group Tell Us?
When we looked at the ROCE trend at EBOS Group, we didn't gain much confidence. To be more specific, ROCE has fallen from 14% over the last five years. On the other hand, the company has been employing more capital without a corresponding improvement in sales in the last year, which could suggest these investments are longer term plays. It's worth keeping an eye on the company's earnings from here on to see if these investments do end up contributing to the bottom line.
The Bottom Line
In summary, EBOS Group is reinvesting funds back into the business for growth but unfortunately it looks like sales haven't increased much just yet. Since the stock has gained an impressive 62% over the last five years, investors must think there's better things to come. However, unless these underlying trends turn more positive, we wouldn't get our hopes up too high.
One more thing, we've spotted 1 warning sign facing EBOS Group that you might find interesting.
While EBOS Group isn't earning the highest return, check out this free list of companies that are earning high returns on equity with solid balance sheets.
Have feedback on this article? Concerned about the content? Get in touch with us directly. Alternatively, email editorial-team (at) simplywallst.com.
This article by Simply Wall St is general in nature. We provide commentary based on historical data and analyst forecasts only using an unbiased methodology and our articles are not intended to be financial advice. It does not constitute a recommendation to buy or sell any stock, and does not take account of your objectives, or your financial situation. We aim to bring you long-term focused analysis driven by fundamental data. Note that our analysis may not factor in the latest price-sensitive company announcements or qualitative material. Simply Wall St has no position in any stocks mentioned.
