
 Yahoo Finance
 Here's What Weibo Corporation's (NASDAQ:WB) P/E Ratio Is Telling Us

Today, we'll introduce the concept of the P/E ratio for those who are learning about investing. To keep it practical, we'll show how Weibo Corporation's (NASDAQ:WB) P/E ratio could help you assess the value on offer. What is Weibo's P/E ratio? Well, based on the last twelve months it is 17.74. That is equivalent to an earnings yield of about 5.6%.
View our latest analysis for Weibo
How Do You Calculate Weibo's P/E Ratio?
The formula for price to earnings is:
Price to Earnings Ratio = Share Price ÷ Earnings per Share (EPS)
Or for Weibo:
P/E of 17.74 = $46.20 ÷ $2.60 (Based on the year to June 2019.)
Is A High Price-to-Earnings Ratio Good?
The higher the P/E ratio, the higher the price tag of a business, relative to its trailing earnings. That isn't necessarily good or bad, but a high P/E implies relatively high expectations of what a company can achieve in the future.
Does Weibo Have A Relatively High Or Low P/E For Its Industry?
The P/E ratio indicates whether the market has higher or lower expectations of a company. If you look at the image below, you can see Weibo has a lower P/E than the average (29.2) in the interactive media and services industry classification.
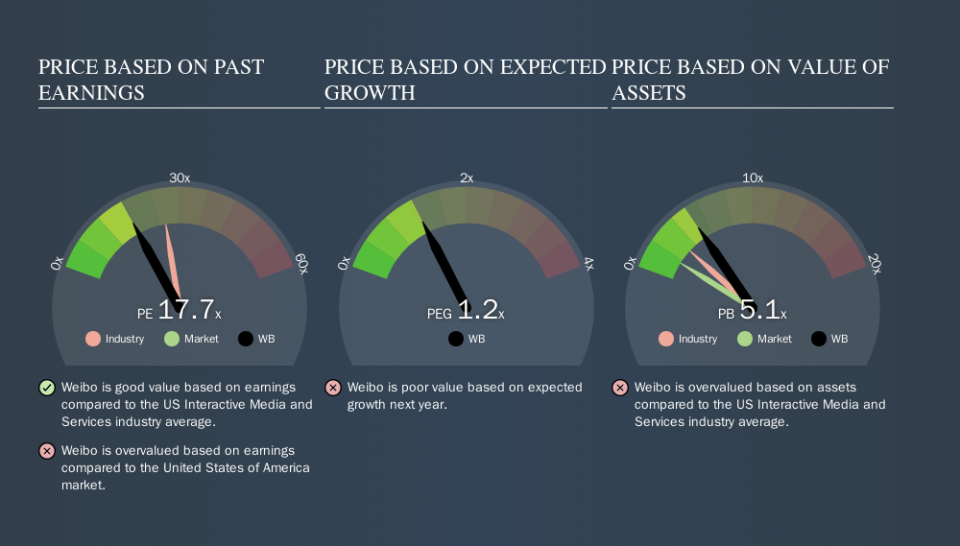
Weibo's P/E tells us that market participants think it will not fare as well as its peers in the same industry. Since the market seems unimpressed with Weibo, it's quite possible it could surprise on the upside. It is arguably worth checking if insiders are buying shares, because that might imply they believe the stock is undervalued.
How Growth Rates Impact P/E Ratios
Probably the most important factor in determining what P/E a company trades on is the earnings growth. If earnings are growing quickly, then the 'E' in the equation will increase faster than it would otherwise. And in that case, the P/E ratio itself will drop rather quickly. A lower P/E should indicate the stock is cheap relative to others -- and that may attract buyers.
Weibo increased earnings per share by an impressive 23% over the last twelve months. And earnings per share have improved by 102% annually, over the last three years. With that performance, you might expect an above average P/E ratio.
A Limitation: P/E Ratios Ignore Debt and Cash In The Bank
The 'Price' in P/E reflects the market capitalization of the company. In other words, it does not consider any debt or cash that the company may have on the balance sheet. The exact same company would hypothetically deserve a higher P/E ratio if it had a strong balance sheet, than if it had a weak one with lots of debt, because a cashed up company can spend on growth.
Spending on growth might be good or bad a few years later, but the point is that the P/E ratio does not account for the option (or lack thereof).
Is Debt Impacting Weibo's P/E?
The extra options and safety that comes with Weibo's US$678m net cash position means that it deserves a higher P/E than it would if it had a lot of net debt.
The Bottom Line On Weibo's P/E Ratio
Weibo has a P/E of 17.7. That's around the same as the average in the US market, which is 17.4. The balance sheet is healthy, and recent EPS growth impressive, but the P/E implies some caution from the market.
When the market is wrong about a stock, it gives savvy investors an opportunity. If the reality for a company is better than it expects, you can make money by buying and holding for the long term. So this free visualization of the analyst consensus on future earnings could help you make the right decision about whether to buy, sell, or hold.
But note: Weibo may not be the best stock to buy. So take a peek at this free list of interesting companies with strong recent earnings growth (and a P/E ratio below 20).
We aim to bring you long-term focused research analysis driven by fundamental data. Note that our analysis may not factor in the latest price-sensitive company announcements or qualitative material.
If you spot an error that warrants correction, please contact the editor at editorial-team@simplywallst.com. This article by Simply Wall St is general in nature. It does not constitute a recommendation to buy or sell any stock, and does not take account of your objectives, or your financial situation. Simply Wall St has no position in the stocks mentioned. Thank you for reading.
