
 Yahoo Finance
 Here's How P/E Ratios Can Help Us Understand Fleetwood Corporation Limited (ASX:FWD)

The goal of this article is to teach you how to use price to earnings ratios (P/E ratios). We'll look at Fleetwood Corporation Limited's (ASX:FWD) P/E ratio and reflect on what it tells us about the company's share price. What is Fleetwood's P/E ratio? Well, based on the last twelve months it is 14.87. In other words, at today's prices, investors are paying A$14.87 for every A$1 in prior year profit.
View our latest analysis for Fleetwood
How Do You Calculate A P/E Ratio?
The formula for price to earnings is:
Price to Earnings Ratio = Price per Share ÷ Earnings per Share (EPS)
Or for Fleetwood:
P/E of 14.87 = A$2.29 ÷ A$0.15 (Based on the year to June 2019.)
Is A High Price-to-Earnings Ratio Good?
A higher P/E ratio implies that investors pay a higher price for the earning power of the business. That is not a good or a bad thing per se, but a high P/E does imply buyers are optimistic about the future.
Does Fleetwood Have A Relatively High Or Low P/E For Its Industry?
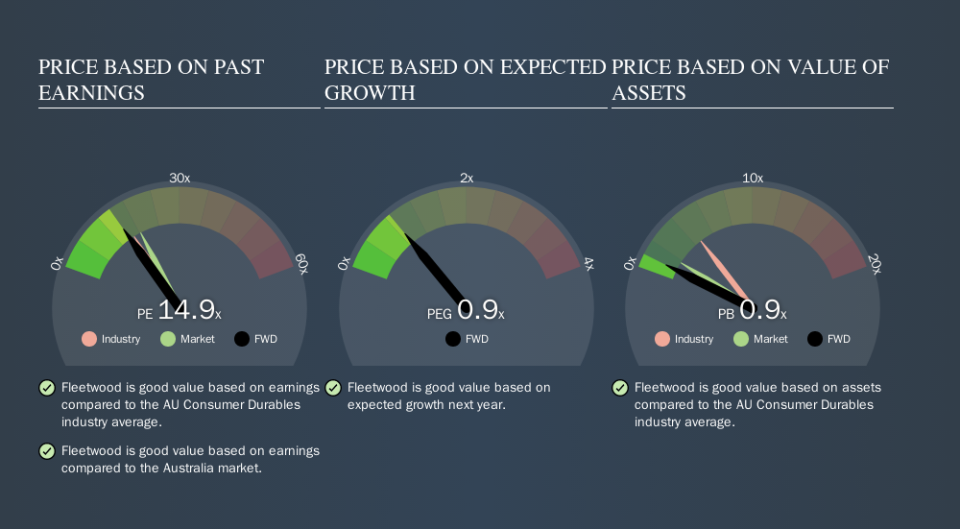
One good way to get a quick read on what market participants expect of a company is to look at its P/E ratio. The image below shows that Fleetwood has a lower P/E than the average (16.1) P/E for companies in the consumer durables industry.
Its relatively low P/E ratio indicates that Fleetwood shareholders think it will struggle to do as well as other companies in its industry classification. Many investors like to buy stocks when the market is pessimistic about their prospects. It is arguably worth checking if insiders are buying shares, because that might imply they believe the stock is undervalued.
How Growth Rates Impact P/E Ratios
P/E ratios primarily reflect market expectations around earnings growth rates. When earnings grow, the 'E' increases, over time. And in that case, the P/E ratio itself will drop rather quickly. Then, a lower P/E should attract more buyers, pushing the share price up.
Fleetwood saw earnings per share decrease by 23% last year. But over the longer term (5 years) earnings per share have increased by 75%.
Don't Forget: The P/E Does Not Account For Debt or Bank Deposits
Don't forget that the P/E ratio considers market capitalization. That means it doesn't take debt or cash into account. In theory, a company can lower its future P/E ratio by using cash or debt to invest in growth.
Such expenditure might be good or bad, in the long term, but the point here is that the balance sheet is not reflected by this ratio.
So What Does Fleetwood's Balance Sheet Tell Us?
With net cash of AU$34m, Fleetwood has a very strong balance sheet, which may be important for its business. Having said that, at 16% of its market capitalization the cash hoard would contribute towards a higher P/E ratio.
The Verdict On Fleetwood's P/E Ratio
Fleetwood trades on a P/E ratio of 14.9, which is below the AU market average of 18.3. The recent drop in earnings per share would almost certainly temper expectations, the relatively strong balance sheet will allow the company time to invest in growth. If it achieves that, then there's real potential that the low P/E could eventually indicate undervaluation.
Investors have an opportunity when market expectations about a stock are wrong. If the reality for a company is not as bad as the P/E ratio indicates, then the share price should increase as the market realizes this. So this free visualization of the analyst consensus on future earnings could help you make the right decision about whether to buy, sell, or hold.
Of course you might be able to find a better stock than Fleetwood. So you may wish to see this free collection of other companies that have grown earnings strongly.
We aim to bring you long-term focused research analysis driven by fundamental data. Note that our analysis may not factor in the latest price-sensitive company announcements or qualitative material.
If you spot an error that warrants correction, please contact the editor at editorial-team@simplywallst.com. This article by Simply Wall St is general in nature. It does not constitute a recommendation to buy or sell any stock, and does not take account of your objectives, or your financial situation. Simply Wall St has no position in the stocks mentioned. Thank you for reading.
