
 Yahoo Finance
 Here's How P/E Ratios Can Help Us Understand AUB Group Limited (ASX:AUB)

This article is written for those who want to get better at using price to earnings ratios (P/E ratios). We'll apply a basic P/E ratio analysis to AUB Group Limited's (ASX:AUB), to help you decide if the stock is worth further research. What is AUB Group's P/E ratio? Well, based on the last twelve months it is 17.99. That means that at current prices, buyers pay A$17.99 for every A$1 in trailing yearly profits.
Check out our latest analysis for AUB Group
How Do You Calculate A P/E Ratio?
The formula for price to earnings is:
Price to Earnings Ratio = Price per Share ÷ Earnings per Share (EPS)
Or for AUB Group:
P/E of 17.99 = AUD12.50 ÷ AUD0.69 (Based on the year to June 2019.)
Is A High Price-to-Earnings Ratio Good?
A higher P/E ratio means that buyers have to pay a higher price for each AUD1 the company has earned over the last year. That is not a good or a bad thing per se, but a high P/E does imply buyers are optimistic about the future.
How Does AUB Group's P/E Ratio Compare To Its Peers?
We can get an indication of market expectations by looking at the P/E ratio. As you can see below AUB Group has a P/E ratio that is fairly close for the average for the insurance industry, which is 19.1.
Its P/E ratio suggests that AUB Group shareholders think that in the future it will perform about the same as other companies in its industry classification. The company could surprise by performing better than average, in the future. I would further inform my view by checking insider buying and selling., among other things.
How Growth Rates Impact P/E Ratios
P/E ratios primarily reflect market expectations around earnings growth rates. Earnings growth means that in the future the 'E' will be higher. Therefore, even if you pay a high multiple of earnings now, that multiple will become lower in the future. And as that P/E ratio drops, the company will look cheap, unless its share price increases.
AUB Group shrunk earnings per share by 4.6% last year. But over the longer term (5 years) earnings per share have increased by 3.5%.
A Limitation: P/E Ratios Ignore Debt and Cash In The Bank
One drawback of using a P/E ratio is that it considers market capitalization, but not the balance sheet. Thus, the metric does not reflect cash or debt held by the company. Hypothetically, a company could reduce its future P/E ratio by spending its cash (or taking on debt) to achieve higher earnings.
Spending on growth might be good or bad a few years later, but the point is that the P/E ratio does not account for the option (or lack thereof).
Is Debt Impacting AUB Group's P/E?
Net debt totals just 3.7% of AUB Group's market cap. The market might award it a higher P/E ratio if it had net cash, but its unlikely this low level of net borrowing is having a big impact on the P/E multiple.
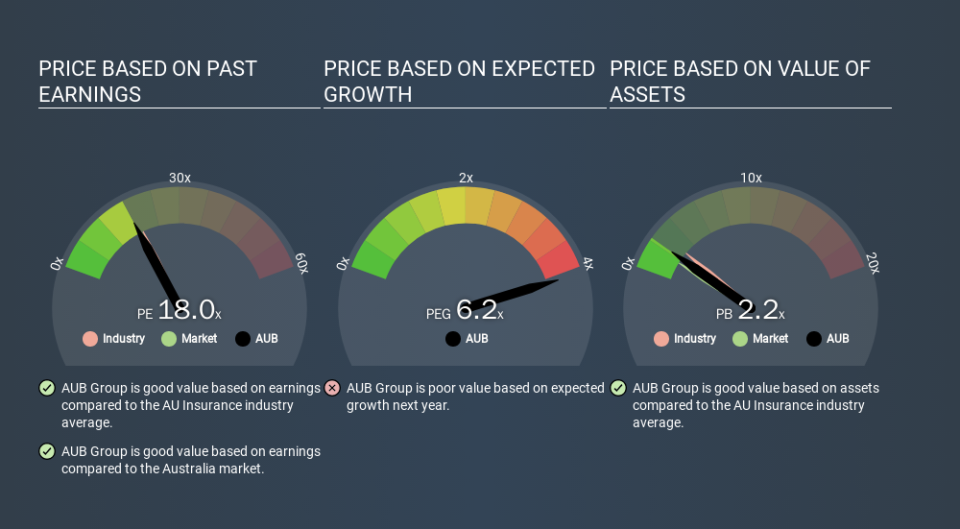
The Bottom Line On AUB Group's P/E Ratio
AUB Group has a P/E of 18.0. That's around the same as the average in the AU market, which is 18.6. Given it has some debt, but didn't grow last year, the P/E indicates the market is expecting higher profits ahead for the business.
Investors have an opportunity when market expectations about a stock are wrong. As value investor Benjamin Graham famously said, 'In the short run, the market is a voting machine but in the long run, it is a weighing machine. So this free visualization of the analyst consensus on future earnings could help you make the right decision about whether to buy, sell, or hold.
Of course, you might find a fantastic investment by looking at a few good candidates. So take a peek at this free list of companies with modest (or no) debt, trading on a P/E below 20.
If you spot an error that warrants correction, please contact the editor at editorial-team@simplywallst.com. This article by Simply Wall St is general in nature. It does not constitute a recommendation to buy or sell any stock, and does not take account of your objectives, or your financial situation. Simply Wall St has no position in the stocks mentioned.
We aim to bring you long-term focused research analysis driven by fundamental data. Note that our analysis may not factor in the latest price-sensitive company announcements or qualitative material. Thank you for reading.
