
 Yahoo Finance
 Here's How P/E Ratios Can Help Us Understand Telstra Corporation Limited (ASX:TLS)

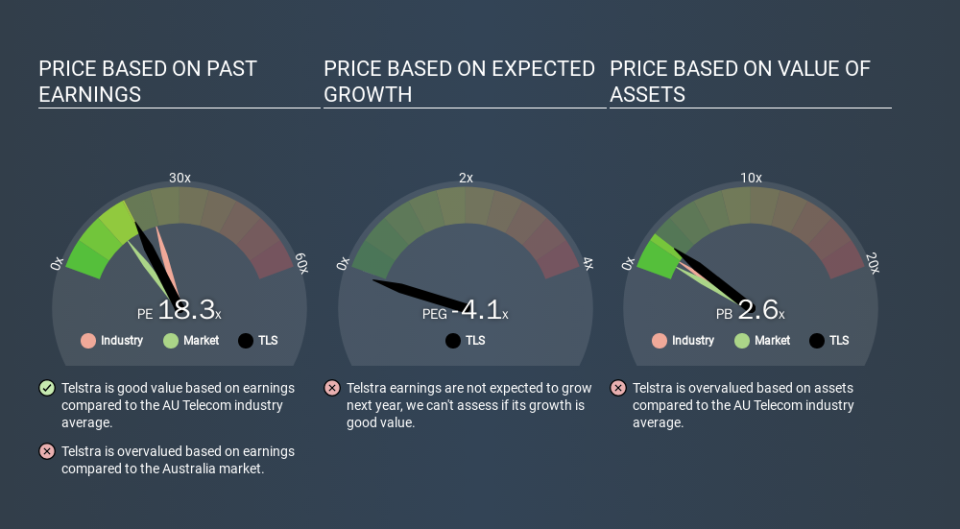
This article is for investors who would like to improve their understanding of price to earnings ratios (P/E ratios). We'll show how you can use Telstra Corporation Limited's (ASX:TLS) P/E ratio to inform your assessment of the investment opportunity. Telstra has a P/E ratio of 18.35, based on the last twelve months. In other words, at today's prices, investors are paying A$18.35 for every A$1 in prior year profit.
View our latest analysis for Telstra
How Do I Calculate Telstra's Price To Earnings Ratio?
The formula for price to earnings is:
Price to Earnings Ratio = Share Price ÷ Earnings per Share (EPS)
Or for Telstra:
P/E of 18.35 = A$3.180 ÷ A$0.173 (Based on the year to December 2019.)
(Note: the above calculation results may not be precise due to rounding.)
Is A High Price-to-Earnings Ratio Good?
The higher the P/E ratio, the higher the price tag of a business, relative to its trailing earnings. That isn't necessarily good or bad, but a high P/E implies relatively high expectations of what a company can achieve in the future.
Does Telstra Have A Relatively High Or Low P/E For Its Industry?
We can get an indication of market expectations by looking at the P/E ratio. We can see in the image below that the average P/E (22.2) for companies in the telecom industry is higher than Telstra's P/E.
Its relatively low P/E ratio indicates that Telstra shareholders think it will struggle to do as well as other companies in its industry classification. While current expectations are low, the stock could be undervalued if the situation is better than the market assumes. You should delve deeper. I like to check if company insiders have been buying or selling.
How Growth Rates Impact P/E Ratios
If earnings fall then in the future the 'E' will be lower. That means unless the share price falls, the P/E will increase in a few years. A higher P/E should indicate the stock is expensive relative to others -- and that may encourage shareholders to sell.
Telstra saw earnings per share decrease by 34% last year. And it has shrunk its earnings per share by 14% per year over the last five years. This could justify a pessimistic P/E.
A Limitation: P/E Ratios Ignore Debt and Cash In The Bank
Don't forget that the P/E ratio considers market capitalization. So it won't reflect the advantage of cash, or disadvantage of debt. The exact same company would hypothetically deserve a higher P/E ratio if it had a strong balance sheet, than if it had a weak one with lots of debt, because a cashed up company can spend on growth.
Such expenditure might be good or bad, in the long term, but the point here is that the balance sheet is not reflected by this ratio.
Telstra's Balance Sheet
Telstra has net debt equal to 40% of its market cap. While it's worth keeping this in mind, it isn't a worry.
The Verdict On Telstra's P/E Ratio
Telstra trades on a P/E ratio of 18.3, which is above its market average of 13.3. With modest debt but no EPS growth in the last year, it's fair to say the P/E implies some optimism about future earnings, from the market.
Investors should be looking to buy stocks that the market is wrong about. If the reality for a company is better than it expects, you can make money by buying and holding for the long term. So this free visual report on analyst forecasts could hold the key to an excellent investment decision.
But note: Telstra may not be the best stock to buy. So take a peek at this free list of interesting companies with strong recent earnings growth (and a P/E ratio below 20).
If you spot an error that warrants correction, please contact the editor at editorial-team@simplywallst.com. This article by Simply Wall St is general in nature. It does not constitute a recommendation to buy or sell any stock, and does not take account of your objectives, or your financial situation. Simply Wall St has no position in the stocks mentioned.
We aim to bring you long-term focused research analysis driven by fundamental data. Note that our analysis may not factor in the latest price-sensitive company announcements or qualitative material. Thank you for reading.
