
 Yahoo Finance
 Here's What Northwest Bancshares, Inc.'s (NASDAQ:NWBI) P/E Is Telling Us

This article is for investors who would like to improve their understanding of price to earnings ratios (P/E ratios). We'll apply a basic P/E ratio analysis to Northwest Bancshares, Inc.'s (NASDAQ:NWBI), to help you decide if the stock is worth further research. Based on the last twelve months, Northwest Bancshares's P/E ratio is 16.08. That corresponds to an earnings yield of approximately 6.2%.
View our latest analysis for Northwest Bancshares
How Do You Calculate A P/E Ratio?
The formula for price to earnings is:
Price to Earnings Ratio = Price per Share ÷ Earnings per Share (EPS)
Or for Northwest Bancshares:
P/E of 16.08 = $17.20 ÷ $1.07 (Based on the year to September 2019.)
Is A High Price-to-Earnings Ratio Good?
The higher the P/E ratio, the higher the price tag of a business, relative to its trailing earnings. That isn't necessarily good or bad, but a high P/E implies relatively high expectations of what a company can achieve in the future.
Does Northwest Bancshares Have A Relatively High Or Low P/E For Its Industry?
The P/E ratio indicates whether the market has higher or lower expectations of a company. The image below shows that Northwest Bancshares has a higher P/E than the average (14.1) P/E for companies in the mortgage industry.
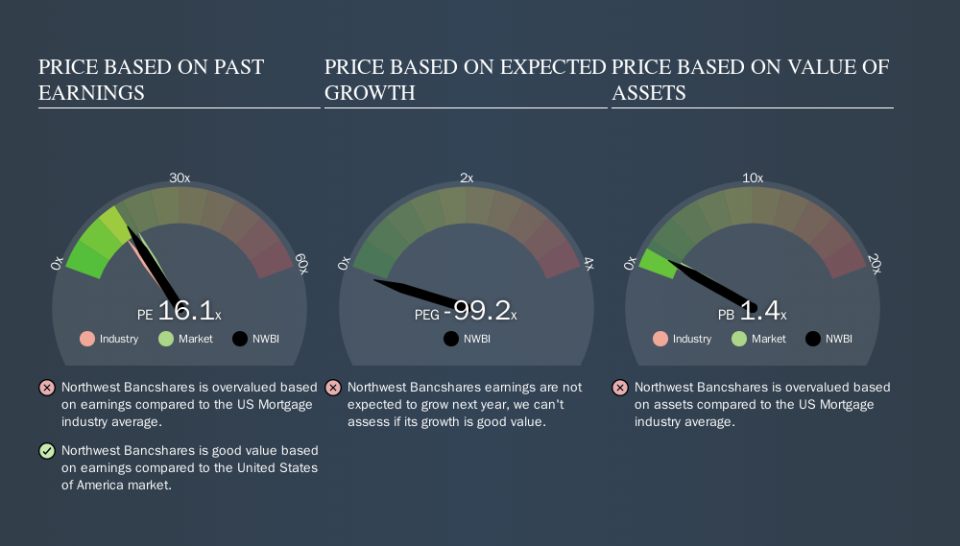
Its relatively high P/E ratio indicates that Northwest Bancshares shareholders think it will perform better than other companies in its industry classification. Clearly the market expects growth, but it isn't guaranteed. So investors should delve deeper. I like to check if company insiders have been buying or selling.
How Growth Rates Impact P/E Ratios
Probably the most important factor in determining what P/E a company trades on is the earnings growth. That's because companies that grow earnings per share quickly will rapidly increase the 'E' in the equation. That means unless the share price increases, the P/E will reduce in a few years. So while a stock may look expensive based on past earnings, it could be cheap based on future earnings.
Northwest Bancshares's earnings per share grew by -7.6% in the last twelve months. And its annual EPS growth rate over 5 years is 8.5%.
A Limitation: P/E Ratios Ignore Debt and Cash In The Bank
Don't forget that the P/E ratio considers market capitalization. In other words, it does not consider any debt or cash that the company may have on the balance sheet. The exact same company would hypothetically deserve a higher P/E ratio if it had a strong balance sheet, than if it had a weak one with lots of debt, because a cashed up company can spend on growth.
Such expenditure might be good or bad, in the long term, but the point here is that the balance sheet is not reflected by this ratio.
So What Does Northwest Bancshares's Balance Sheet Tell Us?
Northwest Bancshares has net debt worth 12% of its market capitalization. It would probably deserve a higher P/E ratio if it was net cash, since it would have more options for growth.
The Bottom Line On Northwest Bancshares's P/E Ratio
Northwest Bancshares has a P/E of 16.1. That's below the average in the US market, which is 17.8. The company hasn't stretched its balance sheet, and earnings are improving. If you believe growth will continue - or even increase - then the low P/E may signify opportunity.
When the market is wrong about a stock, it gives savvy investors an opportunity. If the reality for a company is not as bad as the P/E ratio indicates, then the share price should increase as the market realizes this. So this free visualization of the analyst consensus on future earnings could help you make the right decision about whether to buy, sell, or hold.
Of course you might be able to find a better stock than Northwest Bancshares. So you may wish to see this free collection of other companies that have grown earnings strongly.
We aim to bring you long-term focused research analysis driven by fundamental data. Note that our analysis may not factor in the latest price-sensitive company announcements or qualitative material.
If you spot an error that warrants correction, please contact the editor at editorial-team@simplywallst.com. This article by Simply Wall St is general in nature. It does not constitute a recommendation to buy or sell any stock, and does not take account of your objectives, or your financial situation. Simply Wall St has no position in the stocks mentioned. Thank you for reading.
