
 Yahoo Finance
 Here's What Las Vegas Sands Corp.'s (NYSE:LVS) P/E Is Telling Us

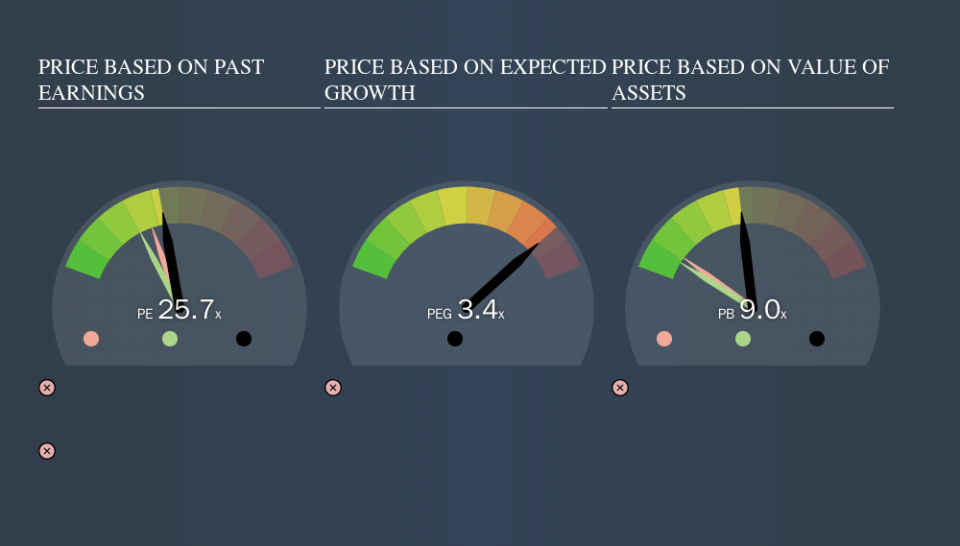
Today, we'll introduce the concept of the P/E ratio for those who are learning about investing. To keep it practical, we'll show how Las Vegas Sands Corp.'s (NYSE:LVS) P/E ratio could help you assess the value on offer. Based on the last twelve months, Las Vegas Sands's P/E ratio is 25.73. That means that at current prices, buyers pay $25.73 for every $1 in trailing yearly profits.
Check out our latest analysis for Las Vegas Sands
How Do You Calculate Las Vegas Sands's P/E Ratio?
The formula for price to earnings is:
Price to Earnings Ratio = Share Price ÷ Earnings per Share (EPS)
Or for Las Vegas Sands:
P/E of 25.73 = $63.14 ÷ $2.45 (Based on the year to September 2019.)
Is A High Price-to-Earnings Ratio Good?
The higher the P/E ratio, the higher the price tag of a business, relative to its trailing earnings. That isn't necessarily good or bad, but a high P/E implies relatively high expectations of what a company can achieve in the future.
How Does Las Vegas Sands's P/E Ratio Compare To Its Peers?
We can get an indication of market expectations by looking at the P/E ratio. As you can see below, Las Vegas Sands has a higher P/E than the average company (22.6) in the hospitality industry.
Its relatively high P/E ratio indicates that Las Vegas Sands shareholders think it will perform better than other companies in its industry classification. Shareholders are clearly optimistic, but the future is always uncertain. So investors should delve deeper. I like to check if company insiders have been buying or selling.
How Growth Rates Impact P/E Ratios
Earnings growth rates have a big influence on P/E ratios. Earnings growth means that in the future the 'E' will be higher. And in that case, the P/E ratio itself will drop rather quickly. So while a stock may look expensive based on past earnings, it could be cheap based on future earnings.
Las Vegas Sands saw earnings per share decrease by 49% last year. But EPS is up 6.3% over the last 3 years. And EPS is down 5.9% a year, over the last 5 years. This might lead to muted expectations.
Remember: P/E Ratios Don't Consider The Balance Sheet
Don't forget that the P/E ratio considers market capitalization. Thus, the metric does not reflect cash or debt held by the company. In theory, a company can lower its future P/E ratio by using cash or debt to invest in growth.
Such spending might be good or bad, overall, but the key point here is that you need to look at debt to understand the P/E ratio in context.
So What Does Las Vegas Sands's Balance Sheet Tell Us?
Las Vegas Sands's net debt is 17% of its market cap. That's enough debt to impact the P/E ratio a little; so keep it in mind if you're comparing it to companies without debt.
The Verdict On Las Vegas Sands's P/E Ratio
Las Vegas Sands trades on a P/E ratio of 25.7, which is above its market average of 18.3. With some debt but no EPS growth last year, the market has high expectations of future profits.
Investors have an opportunity when market expectations about a stock are wrong. People often underestimate remarkable growth -- so investors can make money when fast growth is not fully appreciated. So this free visualization of the analyst consensus on future earnings could help you make the right decision about whether to buy, sell, or hold.
Of course you might be able to find a better stock than Las Vegas Sands. So you may wish to see this free collection of other companies that have grown earnings strongly.
We aim to bring you long-term focused research analysis driven by fundamental data. Note that our analysis may not factor in the latest price-sensitive company announcements or qualitative material.
If you spot an error that warrants correction, please contact the editor at editorial-team@simplywallst.com. This article by Simply Wall St is general in nature. It does not constitute a recommendation to buy or sell any stock, and does not take account of your objectives, or your financial situation. Simply Wall St has no position in the stocks mentioned. Thank you for reading.
