
 Yahoo Finance
 Here's What You Should Know About Texas Roadhouse, Inc.'s (NASDAQ:TXRH) 2.4% Dividend Yield

Could Texas Roadhouse, Inc. (NASDAQ:TXRH) be an attractive dividend share to own for the long haul? Investors are often drawn to strong companies with the idea of reinvesting the dividends. Yet sometimes, investors buy a stock for its dividend and lose money because the share price falls by more than they earned in dividend payments.
With a 2.4% yield and a nine-year payment history, investors probably think Texas Roadhouse looks like a reliable dividend stock. A low yield is generally a turn-off, but if the prospects for earnings growth were strong, investors might be pleasantly surprised by the long-term results. The company also returned around 3.6% of its market capitalisation to shareholders in the form of stock buybacks over the past year. Some simple research can reduce the risk of buying Texas Roadhouse for its dividend - read on to learn more.
Explore this interactive chart for our latest analysis on Texas Roadhouse!
Payout ratios
Dividends are typically paid from company earnings. If a company pays more in dividends than it earned, then the dividend might become unsustainable - hardly an ideal situation. As a result, we should always investigate whether a company can afford its dividend, measured as a percentage of a company's net income after tax. In the last year, Texas Roadhouse paid out 51% of its profit as dividends. This is a fairly normal payout ratio among most businesses. It allows a higher dividend to be paid to shareholders, but does limit the capital retained in the business - which could be good or bad.
In addition to comparing dividends against profits, we should inspect whether the company generated enough cash to pay its dividend. Of the free cash flow it generated last year, Texas Roadhouse paid out 38% as dividends, suggesting the dividend is affordable. It's positive to see that Texas Roadhouse's dividend is covered by both profits and cash flow, since this is generally a sign that the dividend is sustainable, and a lower payout ratio usually suggests a greater margin of safety before the dividend gets cut.
While the above analysis focuses on dividends relative to a company's earnings, we do note Texas Roadhouse's strong net cash position, which will let it pay larger dividends for a time, should it choose.
Consider getting our latest analysis on Texas Roadhouse's financial position here.
Dividend Volatility
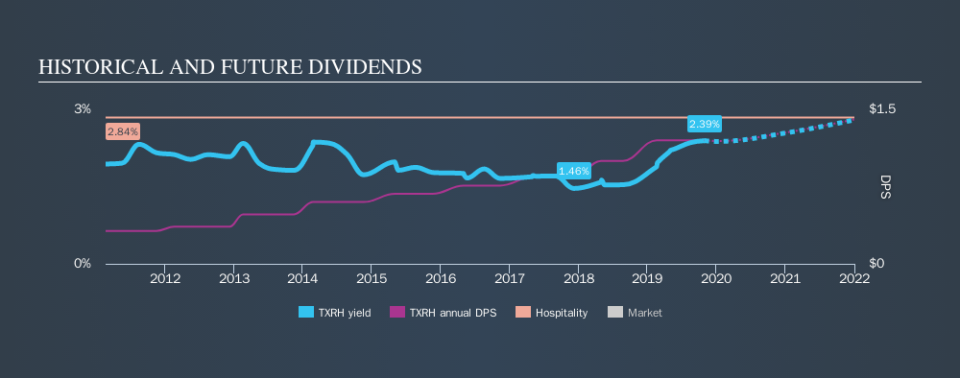
Before buying a stock for its income, we want to see if the dividends have been stable in the past, and if the company has a track record of maintaining its dividend. The first recorded dividend for Texas Roadhouse, in the last decade, was nine years ago. Its dividend has not fluctuated much that time, which we like, but we're conscious that the company might not yet have a track record of maintaining dividends in all economic conditions. During the past nine-year period, the first annual payment was US$0.32 in 2010, compared to US$1.20 last year. This works out to be a compound annual growth rate (CAGR) of approximately 16% a year over that time.
Texas Roadhouse has been growing its dividend quite rapidly, which is exciting. However, the short payment history makes us question whether this performance will persist across a full market cycle.
Dividend Growth Potential
Dividend payments have been consistent over the past few years, but we should always check if earnings per share (EPS) are growing, as this will help maintain the purchasing power of the dividend. Strong earnings per share (EPS) growth might encourage our interest in the company despite fluctuating dividends, which is why it's great to see Texas Roadhouse has grown its earnings per share at 14% per annum over the past five years. Texas Roadhouse's earnings per share have grown rapidly in recent years, although more than half of its profits are being paid out as dividends, which makes us wonder if the company has a limited number of reinvestment opportunities in its business.
Conclusion
To summarise, shareholders should always check that Texas Roadhouse's dividends are affordable, that its dividend payments are relatively stable, and that it has decent prospects for growing its earnings and dividend. Texas Roadhouse's payout ratios are within a normal range for the average corporation, and we like that its cashflow was stronger than reported profits. Next, earnings growth has been good, but unfortunately the company has not been paying dividends as long as we'd like. Texas Roadhouse has a number of positive attributes, but it falls slightly short of our (admittedly high) standards. Were there evidence of a strong moat or an attractive valuation, it could still be well worth a look.
Companies that are growing earnings tend to be the best dividend stocks over the long term. See what the 21 analysts we track are forecasting for Texas Roadhouse for free with public analyst estimates for the company.
If you are a dividend investor, you might also want to look at our curated list of dividend stocks yielding above 3%.
We aim to bring you long-term focused research analysis driven by fundamental data. Note that our analysis may not factor in the latest price-sensitive company announcements or qualitative material.
If you spot an error that warrants correction, please contact the editor at editorial-team@simplywallst.com. This article by Simply Wall St is general in nature. It does not constitute a recommendation to buy or sell any stock, and does not take account of your objectives, or your financial situation. Simply Wall St has no position in the stocks mentioned. Thank you for reading.
