
 Yahoo Finance
 Here's What Johns Lyng Group Limited's (ASX:JLG) P/E Is Telling Us

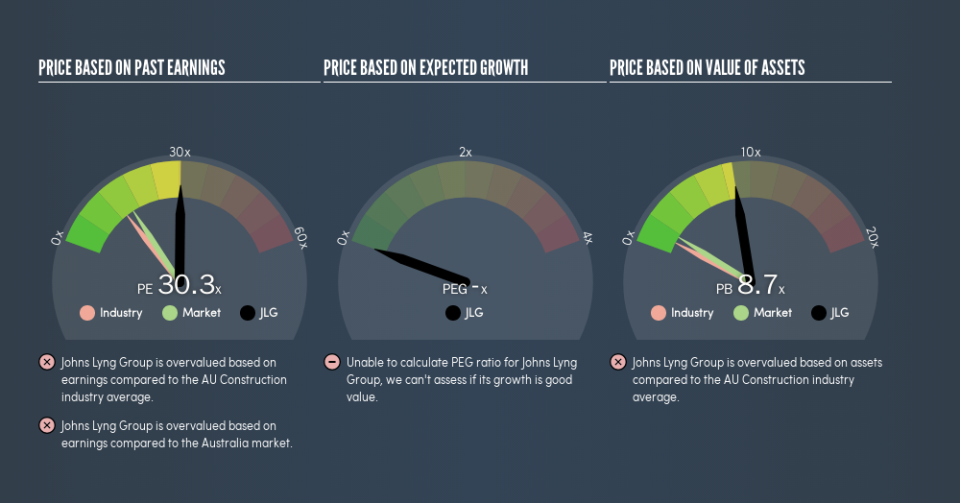
Today, we'll introduce the concept of the P/E ratio for those who are learning about investing. We'll look at Johns Lyng Group Limited's (ASX:JLG) P/E ratio and reflect on what it tells us about the company's share price. What is Johns Lyng Group's P/E ratio? Well, based on the last twelve months it is 30.29. In other words, at today's prices, investors are paying A$30.29 for every A$1 in prior year profit.
Check out our latest analysis for Johns Lyng Group
How Do You Calculate A P/E Ratio?
The formula for P/E is:
Price to Earnings Ratio = Share Price ÷ Earnings per Share (EPS)
Or for Johns Lyng Group:
P/E of 30.29 = A$1.62 ÷ A$0.053 (Based on the trailing twelve months to December 2018.)
Is A High Price-to-Earnings Ratio Good?
A higher P/E ratio means that buyers have to pay a higher price for each A$1 the company has earned over the last year. That isn't necessarily good or bad, but a high P/E implies relatively high expectations of what a company can achieve in the future.
How Does Johns Lyng Group's P/E Ratio Compare To Its Peers?
The P/E ratio indicates whether the market has higher or lower expectations of a company. You can see in the image below that the average P/E (13.7) for companies in the construction industry is lower than Johns Lyng Group's P/E.
Johns Lyng Group's P/E tells us that market participants think the company will perform better than its industry peers, going forward. Clearly the market expects growth, but it isn't guaranteed. So further research is always essential. I often monitor director buying and selling.
How Growth Rates Impact P/E Ratios
When earnings fall, the 'E' decreases, over time. Therefore, even if you pay a low multiple of earnings now, that multiple will become higher in the future. So while a stock may look cheap based on past earnings, it could be expensive based on future earnings.
Johns Lyng Group saw earnings per share decrease by 32% last year. But over the longer term (5 years) earnings per share have increased by 24%. And EPS is down 5.3% a year, over the last 3 years. This might lead to low expectations.
A Limitation: P/E Ratios Ignore Debt and Cash In The Bank
It's important to note that the P/E ratio considers the market capitalization, not the enterprise value. That means it doesn't take debt or cash into account. The exact same company would hypothetically deserve a higher P/E ratio if it had a strong balance sheet, than if it had a weak one with lots of debt, because a cashed up company can spend on growth.
While growth expenditure doesn't always pay off, the point is that it is a good option to have; but one that the P/E ratio ignores.
How Does Johns Lyng Group's Debt Impact Its P/E Ratio?
Since Johns Lyng Group holds net cash of AU$31m, it can spend on growth, justifying a higher P/E ratio than otherwise.
The Bottom Line On Johns Lyng Group's P/E Ratio
Johns Lyng Group's P/E is 30.3 which is above average (15.9) in its market. The recent drop in earnings per share would make some investors cautious, but the net cash position means the company has time to improve: and the high P/E suggests the market thinks it will.
When the market is wrong about a stock, it gives savvy investors an opportunity. If the reality for a company is better than it expects, you can make money by buying and holding for the long term. So this free report on the analyst consensus forecasts could help you make a master move on this stock.
But note: Johns Lyng Group may not be the best stock to buy. So take a peek at this free list of interesting companies with strong recent earnings growth (and a P/E ratio below 20).
We aim to bring you long-term focused research analysis driven by fundamental data. Note that our analysis may not factor in the latest price-sensitive company announcements or qualitative material.
If you spot an error that warrants correction, please contact the editor at editorial-team@simplywallst.com. This article by Simply Wall St is general in nature. It does not constitute a recommendation to buy or sell any stock, and does not take account of your objectives, or your financial situation. Simply Wall St has no position in the stocks mentioned. Thank you for reading.
