
 Yahoo Finance
 Here's What To Make Of Howden Joinery Group's (LON:HWDN) Returns On Capital

If we want to find a potential multi-bagger, often there are underlying trends that can provide clues. Typically, we'll want to notice a trend of growing return on capital employed (ROCE) and alongside that, an expanding base of capital employed. Basically this means that a company has profitable initiatives that it can continue to reinvest in, which is a trait of a compounding machine. However, after investigating Howden Joinery Group (LON:HWDN), we don't think it's current trends fit the mold of a multi-bagger.
Understanding Return On Capital Employed (ROCE)
Just to clarify if you're unsure, ROCE is a metric for evaluating how much pre-tax income (in percentage terms) a company earns on the capital invested in its business. The formula for this calculation on Howden Joinery Group is:
Return on Capital Employed = Earnings Before Interest and Tax (EBIT) ÷ (Total Assets - Current Liabilities)
0.15 = UK£172m ÷ (UK£1.4b - UK£302m) (Based on the trailing twelve months to June 2020).
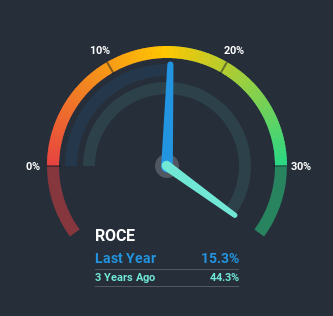
Thus, Howden Joinery Group has an ROCE of 15%. On its own, that's a standard return, however it's much better than the 13% generated by the Trade Distributors industry.
View our latest analysis for Howden Joinery Group
In the above chart we have a measured Howden Joinery Group's prior ROCE against its prior performance, but the future is arguably more important. If you'd like, you can check out the forecasts from the analysts covering Howden Joinery Group here for free.
So How Is Howden Joinery Group's ROCE Trending?
When we looked at the ROCE trend at Howden Joinery Group, we didn't gain much confidence. Over the last five years, returns on capital have decreased to 15% from 45% five years ago. On the other hand, the company has been employing more capital without a corresponding improvement in sales in the last year, which could suggest these investments are longer term plays. It may take some time before the company starts to see any change in earnings from these investments.
On a related note, Howden Joinery Group has decreased its current liabilities to 21% of total assets. That could partly explain why the ROCE has dropped. Effectively this means their suppliers or short-term creditors are funding less of the business, which reduces some elements of risk. Since the business is basically funding more of its operations with it's own money, you could argue this has made the business less efficient at generating ROCE.
What We Can Learn From Howden Joinery Group's ROCE
Bringing it all together, while we're somewhat encouraged by Howden Joinery Group's reinvestment in its own business, we're aware that returns are shrinking. And with the stock having returned a mere 9.8% in the last five years to shareholders, you could argue that they're aware of these lackluster trends. Therefore, if you're looking for a multi-bagger, we'd propose looking at other options.
If you're still interested in Howden Joinery Group it's worth checking out our FREE intrinsic value approximation to see if it's trading at an attractive price in other respects.
For those who like to invest in solid companies, check out this free list of companies with solid balance sheets and high returns on equity.
This article by Simply Wall St is general in nature. It does not constitute a recommendation to buy or sell any stock, and does not take account of your objectives, or your financial situation. We aim to bring you long-term focused analysis driven by fundamental data. Note that our analysis may not factor in the latest price-sensitive company announcements or qualitative material. Simply Wall St has no position in any stocks mentioned.
Have feedback on this article? Concerned about the content? Get in touch with us directly. Alternatively, email editorial-team@simplywallst.com.
