
 Yahoo Finance
 Here's What Euroz Limited's (ASX:EZL) P/E Ratio Is Telling Us

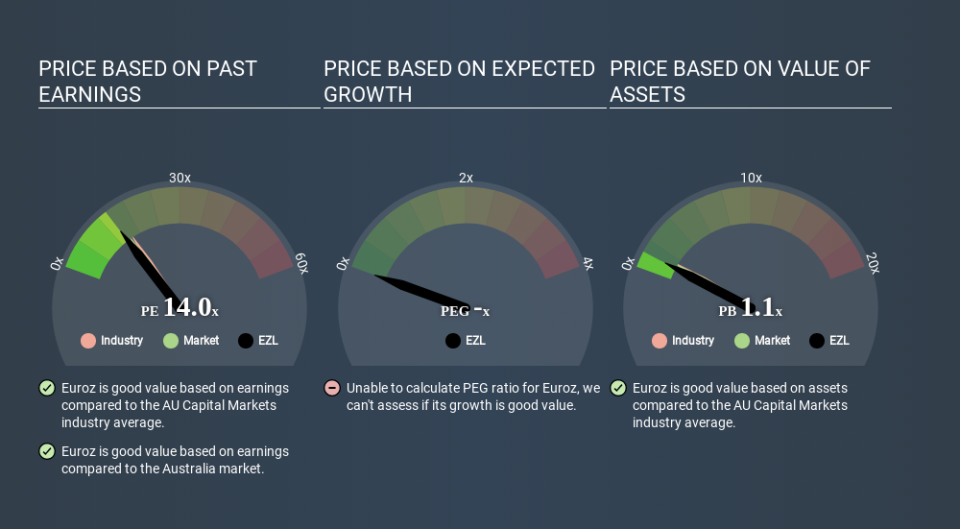
This article is written for those who want to get better at using price to earnings ratios (P/E ratios). We'll show how you can use Euroz Limited's (ASX:EZL) P/E ratio to inform your assessment of the investment opportunity. Looking at earnings over the last twelve months, Euroz has a P/E ratio of 13.95. That is equivalent to an earnings yield of about 7.2%.
See our latest analysis for Euroz
How Do You Calculate A P/E Ratio?
The formula for price to earnings is:
Price to Earnings Ratio = Price per Share ÷ Earnings per Share (EPS)
Or for Euroz:
P/E of 13.95 = A$0.945 ÷ A$0.068 (Based on the trailing twelve months to December 2019.)
(Note: the above calculation results may not be precise due to rounding.)
Is A High Price-to-Earnings Ratio Good?
A higher P/E ratio implies that investors pay a higher price for the earning power of the business. That isn't necessarily good or bad, but a high P/E implies relatively high expectations of what a company can achieve in the future.
How Does Euroz's P/E Ratio Compare To Its Peers?
The P/E ratio essentially measures market expectations of a company. We can see in the image below that the average P/E (15.7) for companies in the capital markets industry is higher than Euroz's P/E.
This suggests that market participants think Euroz will underperform other companies in its industry. Many investors like to buy stocks when the market is pessimistic about their prospects. You should delve deeper. I like to check if company insiders have been buying or selling.
How Growth Rates Impact P/E Ratios
Companies that shrink earnings per share quickly will rapidly decrease the 'E' in the equation. That means unless the share price falls, the P/E will increase in a few years. Then, a higher P/E might scare off shareholders, pushing the share price down.
Euroz shrunk earnings per share by 31% over the last year. But EPS is up 6.1% over the last 5 years. And over the longer term (3 years) earnings per share have decreased 13% annually. This might lead to low expectations.
Remember: P/E Ratios Don't Consider The Balance Sheet
The 'Price' in P/E reflects the market capitalization of the company. That means it doesn't take debt or cash into account. In theory, a company can lower its future P/E ratio by using cash or debt to invest in growth.
Such expenditure might be good or bad, in the long term, but the point here is that the balance sheet is not reflected by this ratio.
So What Does Euroz's Balance Sheet Tell Us?
Euroz has net cash of AU$27m. This is fairly high at 18% of its market capitalization. That might mean balance sheet strength is important to the business, but should also help push the P/E a bit higher than it would otherwise be.
The Bottom Line On Euroz's P/E Ratio
Euroz trades on a P/E ratio of 14.0, which is fairly close to the AU market average of 15.0. While the absence of growth in the last year is probably causing a degree of pessimism, the net cash position means it's not surprising that expectations put the company roughly in line with the market average P/E.
Investors have an opportunity when market expectations about a stock are wrong. If it is underestimating a company, investors can make money by buying and holding the shares until the market corrects itself. We don't have analyst forecasts, but you could get a better understanding of its growth by checking out this more detailed historical graph of earnings, revenue and cash flow.
Of course, you might find a fantastic investment by looking at a few good candidates. So take a peek at this free list of companies with modest (or no) debt, trading on a P/E below 20.
Love or hate this article? Concerned about the content? Get in touch with us directly. Alternatively, email editorial-team@simplywallst.com.
This article by Simply Wall St is general in nature. It does not constitute a recommendation to buy or sell any stock, and does not take account of your objectives, or your financial situation. We aim to bring you long-term focused analysis driven by fundamental data. Note that our analysis may not factor in the latest price-sensitive company announcements or qualitative material. Simply Wall St has no position in any stocks mentioned. Thank you for reading.
