
 Yahoo Finance
 Here's What ASX Limited's (ASX:ASX) P/E Is Telling Us

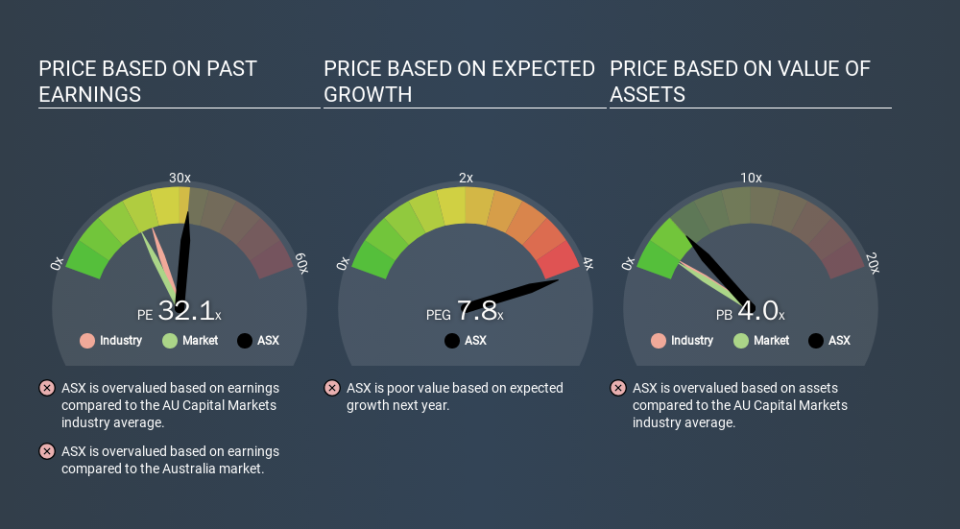
Today, we'll introduce the concept of the P/E ratio for those who are learning about investing. To keep it practical, we'll show how ASX Limited's (ASX:ASX) P/E ratio could help you assess the value on offer. What is ASX's P/E ratio? Well, based on the last twelve months it is 32.15. That corresponds to an earnings yield of approximately 3.1%.
Check out our latest analysis for ASX
How Do You Calculate ASX's P/E Ratio?
The formula for price to earnings is:
Price to Earnings Ratio = Price per Share ÷ Earnings per Share (EPS)
Or for ASX:
P/E of 32.15 = A$81.71 ÷ A$2.54 (Based on the year to June 2019.)
Is A High P/E Ratio Good?
A higher P/E ratio implies that investors pay a higher price for the earning power of the business. All else being equal, it's better to pay a low price -- but as Warren Buffett said, 'It's far better to buy a wonderful company at a fair price than a fair company at a wonderful price.
Does ASX Have A Relatively High Or Low P/E For Its Industry?
One good way to get a quick read on what market participants expect of a company is to look at its P/E ratio. As you can see below, ASX has a higher P/E than the average company (22.0) in the capital markets industry.
Its relatively high P/E ratio indicates that ASX shareholders think it will perform better than other companies in its industry classification. Shareholders are clearly optimistic, but the future is always uncertain. So investors should delve deeper. I like to check if company insiders have been buying or selling.
How Growth Rates Impact P/E Ratios
Earnings growth rates have a big influence on P/E ratios. If earnings are growing quickly, then the 'E' in the equation will increase faster than it would otherwise. And in that case, the P/E ratio itself will drop rather quickly. Then, a lower P/E should attract more buyers, pushing the share price up.
It's great to see that ASX grew EPS by 10% in the last year. And it has bolstered its earnings per share by 5.1% per year over the last five years. With that performance, you might expect an above average P/E ratio.
A Limitation: P/E Ratios Ignore Debt and Cash In The Bank
Don't forget that the P/E ratio considers market capitalization. Thus, the metric does not reflect cash or debt held by the company. Theoretically, a business can improve its earnings (and produce a lower P/E in the future) by investing in growth. That means taking on debt (or spending its cash).
While growth expenditure doesn't always pay off, the point is that it is a good option to have; but one that the P/E ratio ignores.
How Does ASX's Debt Impact Its P/E Ratio?
ASX has net cash of AU$1.5b. That should lead to a higher P/E than if it did have debt, because its strong balance sheets gives it more options.
The Bottom Line On ASX's P/E Ratio
ASX has a P/E of 32.1. That's higher than the average in its market, which is 18.6. Its strong balance sheet gives the company plenty of resources for extra growth, and it has already proven it can grow. So it does not seem strange that the P/E is above average.
When the market is wrong about a stock, it gives savvy investors an opportunity. If the reality for a company is better than it expects, you can make money by buying and holding for the long term. So this free visual report on analyst forecasts could hold the key to an excellent investment decision.
But note: ASX may not be the best stock to buy. So take a peek at this free list of interesting companies with strong recent earnings growth (and a P/E ratio below 20).
If you spot an error that warrants correction, please contact the editor at editorial-team@simplywallst.com. This article by Simply Wall St is general in nature. It does not constitute a recommendation to buy or sell any stock, and does not take account of your objectives, or your financial situation. Simply Wall St has no position in the stocks mentioned.
We aim to bring you long-term focused research analysis driven by fundamental data. Note that our analysis may not factor in the latest price-sensitive company announcements or qualitative material. Thank you for reading.
